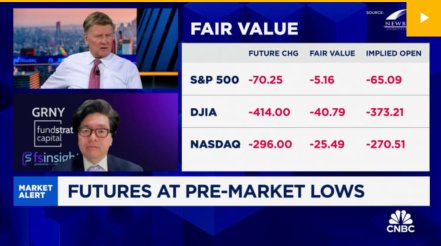
We hope you and your family had a happy and joyous holiday. Stocks ended last week down, continuing a slide that began before the New Year. One obvious question arises: Does this decline signal a turning point for stocks?
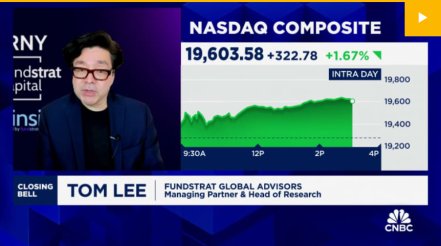
“We don’t think so,” responded Fundstrat Head of Research Tom Lee. In his view, the tailwinds that helped 2024 gain more than 20% for a second straight year remain in place. In fact, those tailwinds “are arguably stronger in 2025 than they were in 2024,” he told us.
In the near term, Lee acknowledged that 2024 “ended on a whimper,” but historical precedent suggests that this lackluster year-end could set up a strong January. The last trading week of 2024 saw four straight daily declines, and when the Fundstrat Data Science team looked at historically similar precedents, they found reason for constructiveness.
Since 1928, there have been 10 previous instances of three or more consecutive daily declines in the final trading week of the year. Stocks were up one month later 80% of the time, with a median gain of 3.6%. Looking further out, stocks were up 12 months later 80% of the time as well, with median gains of 12.4%. That doesn’t mean this coming week will necessarily see a bounce, however. Fundstrat Head of Technical Strategy Mark Newton observed that “while I expect that this consolidation should be complete by mid-January, it’s hard to claim technically just yet that lows are in place.”
To Lee, this means that a continued pullback might be possible, but that would represent a buying opportunity. “Buying the dip continues to make sense, in our view,” he concluded.
Chart of the Week
This year, a longer-term tailwind could come in the form of the ISM Manufacturing PMI. The December reading came out on Friday, reaching a nine-month high. This is a metric Lee and his team are closely monitoring. “ISM manufacturing has been below 50 for 26 months (since Oct 2022), and we think it is set to rise above 50 in 2025,” Lee said, with the Federal Reserve in an easing cycle and an incoming White House that is seen as business-friendly. “As we’ve noted in the past, ISM Manufacturing tends to lead S&P 500 PS growth rates by roughly four months,” so “we would see a recovery in ISM to above the 50 mark as a signal for improving EPS growth.” This can be seen in our Chart of the Week.
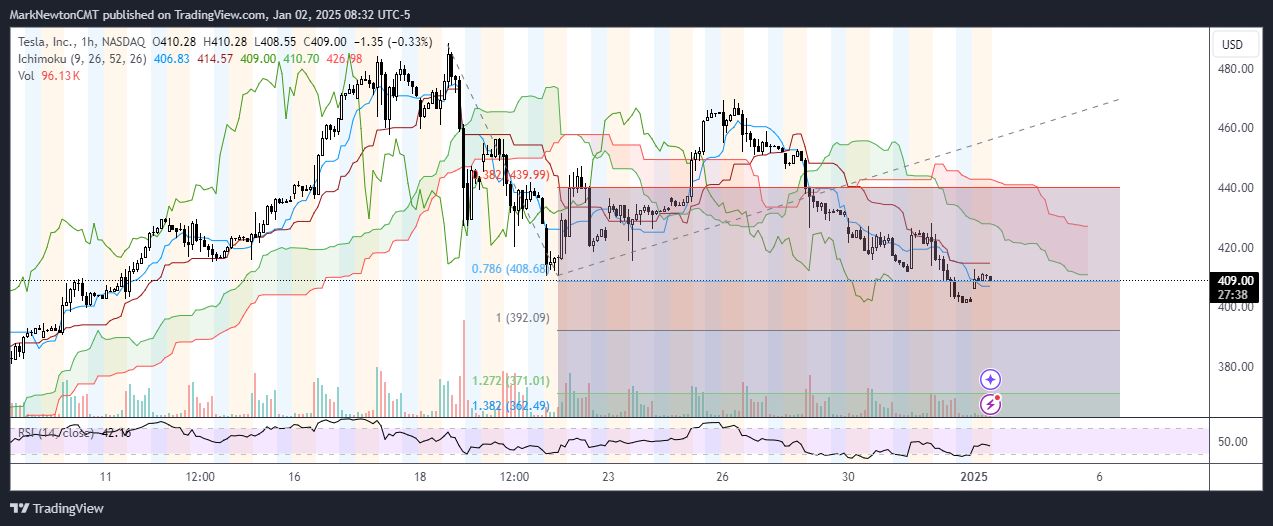
One quick update on TSLA 8.84% – The stock’s short-term pattern turned more negative on the violation of $415.41 this past Tuesday (New Year’s Eve) and today’s Q4 deliveries missed consensus and their 1st Quarter sales drop of 1.1% marks the first annual EV sales decline in a nearly a decade. While this brought about an “open-gap” this morning, this decline also appears short-term in nature and will make TSLA attractive if/when this reaches its 50% retracement level near 350 (which cannot be ruled out) My technical expectation is for a drop to $344-$362 before this bottoms which would make TSLA an appealing risk/reward for buying dips. Thus, similar to SPX, this has pulled back in an ABC-type pattern, while its larger trends and momentum remain quite bullish. Overall, I expect a bit more weakness over the next 4-6 trading days ahead of a possible low, and patience here is also needed in the short term, as lows do not yet seem to be in place.
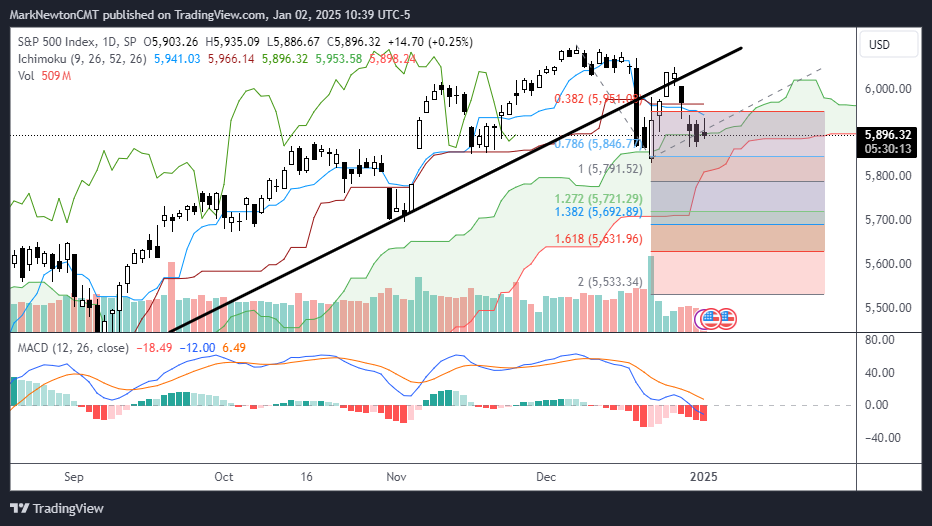
This daily ^SPX 1.25% chart helps to put this recent consolidation in US Equities into perspective. While the intermediate-term SPX uptrend intersects near 5700, the short-term trends and momentum are still negative. Key levels for today into tomorrow’s close lie at resistance ranges at 5945-68 for SPX on the upside and 5832-5868 on the downside. Any break of this week’s lows at 5868.86 should result in mid-December’s lows being tested at 5832. If this level breaks (which is a distinct possibility) then it’s likely that SPX 12/6-12/20 decline should be approximated in both time and price before bottoming, ultimately forming an ABC-type pattern over the next week. The good news for the “bulls” is that downside likely should not prove too extreme in either price or time before bottoming, and my downside area of stronger support lies at the 5650-5700 area. Overall, patience is required, but this ultimately should bring in buying opportunities sooner than later as fear should most certainly escalate if/when December lows at 5832.30 (SPX) are violated.
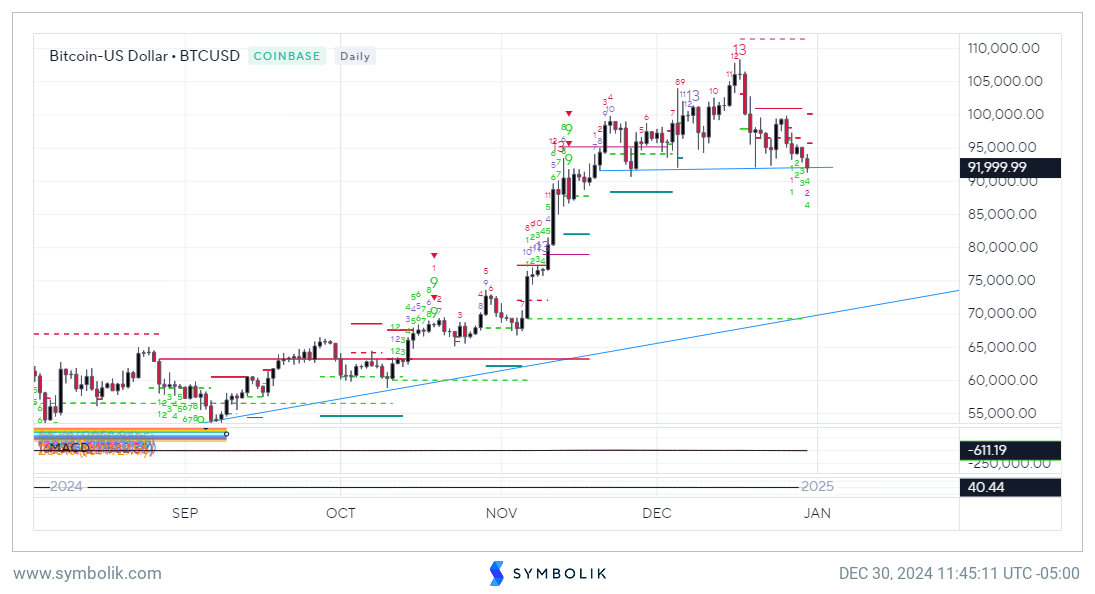
BTC Bitcoin has also broken 12/20 lows as of today, $92118, which constitutes a violation of the entire support since early November. (Recall that cycles called for BTC to peak in mid-December and potentially suffer a short-term correction in the 1st Quarter of 2025, bottoming in March) Given that the cycles seemed to peak “on-time”, i have no reason to expect the trajectory for a further correction would be incorrect. Furthermore, a break of 92,118 on a daily close would allow for initially a pullback to $83k, which would roughly approximate the length of the first move down from $108k when measured from 12/26 peaks. Overall, the key point here is that a breakdown of $92.118 is a near-term negative development for BTC and would allow for at least a move down to 83k initially before much stabilization.
This research is for the clients of FS Insight only. FSI Subscription entitles the subscriber to 1 user, research cannot be shared or redistributed. For additional information, please contact your sales representative or FS Insight at fsinsight.com.
Conflicts of Interest
This research contains the views, opinions and recommendations of FS Insight. At the time of publication of this report, FS Insight does not know of, or have reason to know of any material conflicts of interest.
General Disclosures
FS Insight is an independent research company and is not a registered investment advisor and is not acting as a broker dealer under any federal or state securities laws.
FS Insight is a member of IRC Securities’ Research Prime Services Platform. IRC Securities is a FINRA registered broker-dealer that is focused on supporting the independent research industry. Certain personnel of FS Insight (i.e. Research Analysts) are registered representatives of IRC Securities, a FINRA member firm registered as a broker-dealer with the Securities and Exchange Commission and certain state securities regulators. As registered representatives and independent contractors of IRC Securities, such personnel may receive commissions paid to or shared with IRC Securities for transactions placed by FS Insight clients directly with IRC Securities or with securities firms that may share commissions with IRC Securities in accordance with applicable SEC and FINRA requirements. IRC Securities does not distribute the research of FS Insight, which is available to select institutional clients that have engaged FS Insight.
As registered representatives of IRC Securities our analysts must follow IRC Securities’ Written Supervisory Procedures. Notable compliance policies include (1) prohibition of insider trading or the facilitation thereof, (2) maintaining client confidentiality, (3) archival of electronic communications, and (4) appropriate use of electronic communications, amongst other compliance related policies.
FS Insight does not have the same conflicts that traditional sell-side research organizations have because FS Insight (1) does not conduct any investment banking activities, and (2) does not manage any investment funds.
This communication is issued by FS Insight and/or affiliates of FS Insight. This is not a personal recommendation, nor an offer to buy or sell nor a solicitation to buy or sell any securities, investment products or other financial instruments or services. This material is distributed for general informational and educational purposes only and is not intended to constitute legal, tax, accounting or investment advice.
The statements in this document shall not be considered as an objective or independent explanation of the matters. Please note that this document (a) has not been prepared in accordance with legal requirements designed to promote the independence of investment research, and (b) is not subject to any prohibition on dealing ahead of the dissemination or publication of investment research.
Intended for recipient only and not for further distribution without the consent of FS Insight.
This research is for the clients of FS Insight only. Additional information is available upon request. Information has been obtained from sources believed to be reliable, but FS Insight does not warrant its completeness or accuracy except with respect to any disclosures relative to FS Insight and the analyst’s involvement (if any) with any of the subject companies of the research. All pricing is as of the market close for the securities discussed, unless otherwise stated. Opinions and estimates constitute our judgment as of the date of this material and are subject to change without notice. Past performance is not indicative of future results. This material is not intended as an offer or solicitation for the purchase or sale of any financial instrument. The opinions and recommendations herein do not take into account individual client circumstances, risk tolerance, objectives, or needs and are not intended as recommendations of particular securities, financial instruments or strategies. The recipient of this report must make its own independent decision regarding any securities or financial instruments mentioned herein. Except in circumstances where FS Insight expressly agrees otherwise in writing, FS Insight is not acting as a municipal advisor and the opinions or views contained herein are not intended to be, and do not constitute, advice, including within the meaning of Section 15B of the Securities Exchange Act of 1934. All research reports are disseminated and available to all clients simultaneously through electronic publication to our internal client website, fsinsight.com. Not all research content is redistributed to our clients or made available to third-party aggregators or the media. Please contact your sales representative if you would like to receive any of our research publications.