September has been quite a ride for investors so far. After a nosedive of 4% at the beginning of the month, the S&P 500 has largely clawed its way back.
Inflation continues to fall, with August CPI and PPI data released last week showing that inflation is trending close to 40-year averages. While Core CPI came in hotter than expected, Fundstrat Head of Research Tom Lee interpreted the data as “better than it looks.” It “doesn’t change the fact that inflation is indeed falling fast,” he added. Aside from the statistically lagging shelter component, the biggest contributors to August Core CPI were travel-related – airline fares and (non-shelter) lodging. “Did inflation suddenly accelerate in Shelter and airline fares?” Lee asked rhetorically. “We don’t think so. To us, this looks more like seasonal-adjustment noise.”
There appears to be consensus agreement that the inflation numbers will not cause the Fed to push back the rate cuts that officials have recently hinted will begin at next Wednesday’s Federal Open Markets Committee (FOMC) meeting. Lee expects that this means tailwinds for stocks. Yet, “we just saw the fourth-worst start for September,” Lee reminded us. He and his team found that when looking at the historical “first four trading days” of September and examining the 20 worst instances for stocks, not once in those 20 precedents has September ended up positive. “Sure, history is meant to be broken,” he conceded, “but in my view, this is telling us that we are in for a challenging time leading up to Election Day.“
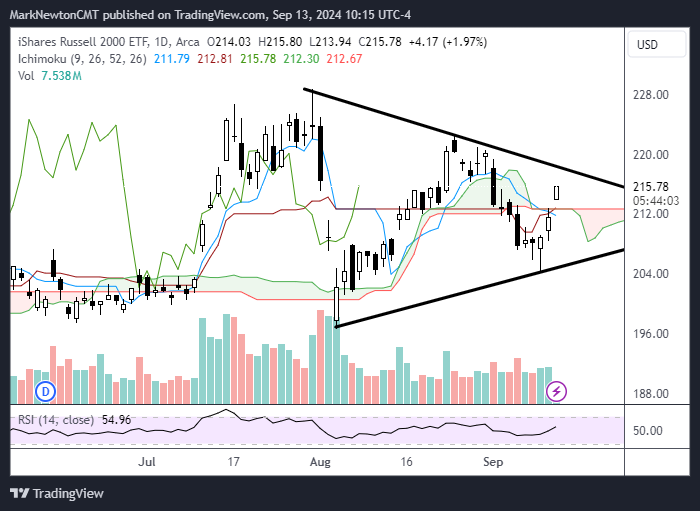
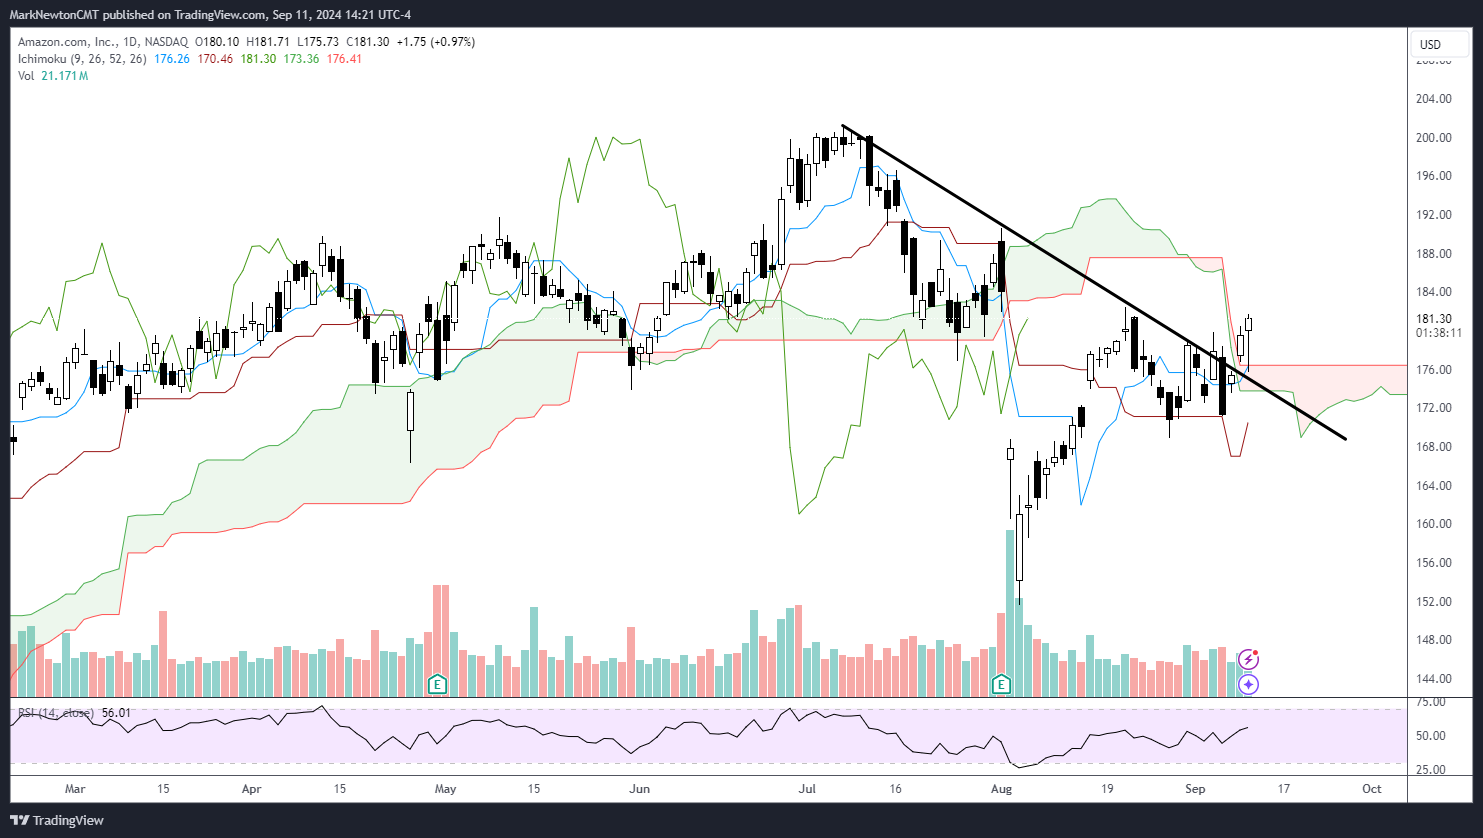
Head of Technical Strategy Mark Newton acknowledged that “the stock market has been a lot choppier since July, but outside of Technology, it has mostly held up extraordinarily well. And with regard to Technology, despite this huge sell off, it really has not broken levels to think that Tech is going to weaken from here. In fact, Tech has been an outperformer all week.”
“It’s really important for trend followers that the S&P 500 gets up above the 5,650 level,” he asserted. “That will allow for a pretty decent rally, in my view, but for now, we’re still sort of choppy and range bound, held by 5400 on the downside and 5650 on the upside.”

Chart of the Week

If the Fed does indeed cut rates at the FOMC on Wednesday, as widely expected, the bearishly inclined are warning that this could actually be bad for stocks. They note (correctly) that historically, stocks have fallen half the time immediately after the Fed makes its first cut of a cycle. However, Head of Data Science “Tireless” Ken Xuan and his team took a deeper look historical cycles and came to a different conclusion. Examining the last 11 Fed “first cuts,” Xuan found that five of them took place with a recessionary backdrop. The other six came during a non-recessionary, “no landing” scenario such as the one in which we currently find ourselves. The difference in historic post-cut win ratios between the two categories is significant and best illustrated by our Chart of the Week.
Recent ⚡ FlashInsights
FSI Video: Weekly Highlight

Key incoming data
9/9 9:00 AM ET: Aug F Manheim Used vehicle indexMixed9/9 11:00 AM ET: Aug NY Fed 1yr Inf ExpTame9/10 6:00 AM ET: Aug Small Business Optimism SurveyTame9/11 8:30 AM ET: Aug CPITame9/12 8:30 AM ET: Aug PPITame9/13 10:00 AM ET: Sep P U. Mich. Sentiment and Inflation ExpectationTame- 9/16 8:30 AM ET: Sep Empire Manufacturing Survey
- 9/17 8:30 AM ET: Aug Retail Sales Data
- 9/17 9:00 AM ET: Sep M Manheim Used vehicle index
- 9/17 10:00 AM ET: Sep NAHB Housing Market Index
- 9/18 2:00 PM ET: Sep FOMC Decision
- 9/18 4:00 PM ET: Jul Net TIC Flows
- 9/19 8:30 AM ET: Sep Philly Fed Business Outlook
- 9/19 10:00 AM ET: Aug Existing Home Sales
Stock List Performance

In the News
| More News Appearances |


