

The S&P 500 ended its weekly winning streak at five with a 0.51% decline after the Memorial Day holiday, but stocks still ended the month of May up roughly 4.8%. Fundstrat Head of Research Tom Lee suggested that investors “buy the dip.” His constructiveness is driven by seasonality, low levels of leverage, high (and still rising) levels of cash on the sidelines, and a strong earnings season that shows that the AI transformation is, in his view, “still going strong.”
Historically – when stocks have seen a positive first quarter and a down April while the economy was not in a recession – June has turned out to be a positive month for equities 11 out of 11 times, with a median gain of 3.4%. “Seasonality alone thus implies that the S&P 500 could end June near 5,500, or >200 points higher,” Lee pointed out.
Head of Technical Strategy Mark Newton chimed in by highlighting another aspect of seasonality. “June is a much stronger month in an election year than really any other month outside of November,” he reminded us at our weekly research huddle.
Friday saw the release of updated Personal Consumption Expenditures (PCE) index, the Federal Reserve’s preferred inflation indicator. Core PCE came in at the lowest levels of the year, and a dive into the details saw a slowdown in consumer spending. More importantly, “excluding housing, PCE inflation is on target,” Lee observed, with Core PCE ex-housing dripping lower in April to 2.15% vs 2.19% YoY in March. What’s more, the latest Case-Schiller home price update, released last week, showed home-price inflation slowing. This means that for PCE, “we believe these improvements are sustainable,” he said.
Friday’s PCE release was followed by what Newton described as a “sharp pullback in yields.” He added, “The cycle that I use for Treasury yields shows a pretty steep decline for yields between now and September. This could be related to weaker economic growth and/or a continuation of the disinflationary trend, either of which would be good for stocks.”

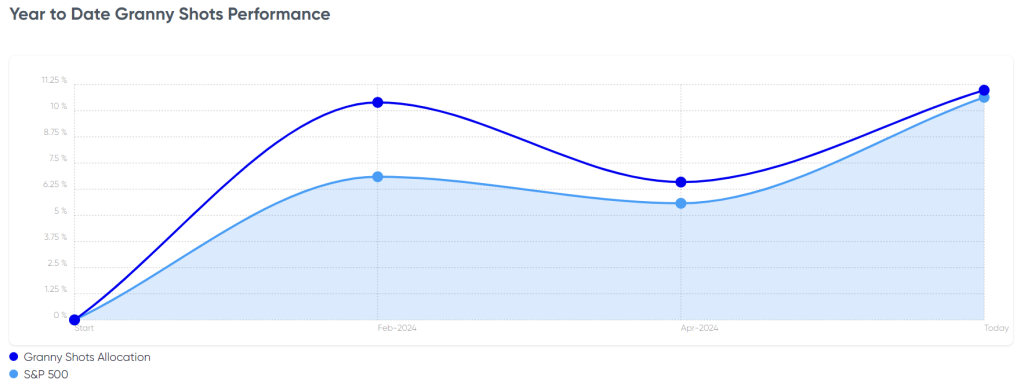
Chart of the Week
Ahead of the PCE release on Friday, Lee pointed out that market movements after PCE data have generally been positive since 2023 – particularly when stocks have been down in the week leading up to the release. “Four out of four times, after PCE was released, stocks were higher a week later,” Lee pointed out, “and, interestingly, that was true even though, in three out of four of those instances, PCE came out worse than expected.” This can be seen in our Chart of the Week
Recent ⚡ FlashInsights
[fsi-flash-insights]
FSI Video: Weekly Highlight

Key incoming data
5/28 9:00 AM ET: Mar S&P CoreLogic CS home priceTame5/28 10:00 AM ET: May Conference Board Consumer ConfidenceTame5/28 10:30 AM ET: May Dallas Fed Manuf. Activity SurveyTame5/29 2:00 PM ET: May Fed Releases Beige BookTame5/30 8:30 AM ET: 1Q S 2024 GDPTame5/31 8:30 AM ET: Apr PCE DeflatorTame- 6/3 9:45 AM ET: May F S&P Global Manufacturing PMI
- 6/3 10:00 AM ET: May ISM Manufacturing PMI
- 6/4 10:00 AM ET: Apr JOLTS Job Openings
- 6/4 10:00 AM ET: Apr F Durable Goods Orders
- 6/5 9:45 AM ET: May F S&P Global Services PMI
- 6/5 10:00 AM ET: May ISM Services PMI
- 6/6 8:30 AM ET: 1Q F Nonfarm Productivity
- 6/6 8:30 AM ET: Apr Trade Balance
- 6/6 8:30 AM ET: 1Q F Unit Labor Costs
- 6/7 8:30 AM ET: May Jobs Report
- 6/7 9:00 AM ET: May F Manheim Used vehicle index

Stock List Performance
In the News
[fsi-in-the-news]