


Equities had something of an uncertain start this week, with the S&P 500, Nasdaq, and DJIA all declining at first. The S&P 500 fell more than 1% on Tuesday, but as Fundstrat Head of Research Tom Lee pointed out, after each of the last two times such declines took place – January 31, 2024 and February 13, 2024, “those dips were bought and the market went on to make new highs.” That happened again this week, with the S&P 500 making new highs on Thursday.
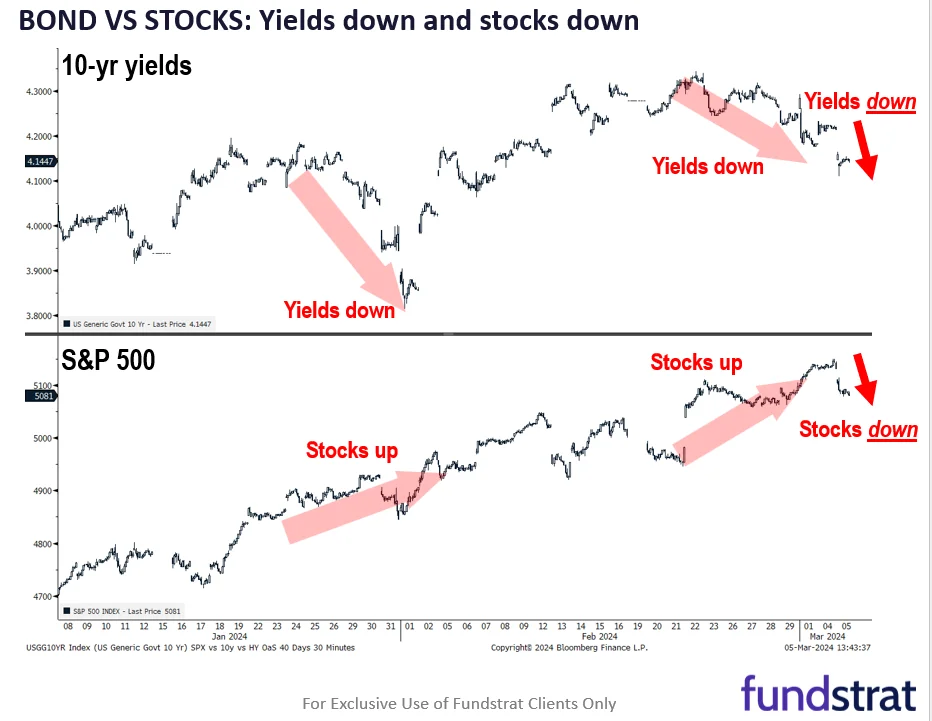
Nevertheless, Lee sounded a cautionary note. As he has pointed out in the past, one signal of an impending top is stocks falling after good news. As he sees it, “in a way, a drop in rates is a ‘good news’ event,” yet when yields fell on Tuesday, the stock market also fell (as shown in our Chart of the Week below). Because of this, he urges watchfulness even though he continues to suspect that there is still “gas in the tank” of this rally.
Like Lee, Fundstrat Head of Technical Strategy Mark Newton remains constructive on equities. “I suspect that SPX is en route to ~5200 and potentially even 5250 by March 20, and it’s necessary for SPX to break 5057 on a daily close to have any concern about even a minor two-day pullback,” he said. Newton also pointed out that the equal-weighted S&P 500 has made its sixth straight weekly gain. “Technology underperformance is making the market seem worse than it actually is […] and it’s worth pointing out that the most recent weekly close for SPX is only the third negative week in four and a half months.”
BTC hit a new all-time high on Tuesday, in part due to significant inflows into BlackRock and Fidelity ETFs. “For those just entering the fold, new all-time highs are historically great entry points,” pointed out Fundstrat Head of Digital Assets Sean Farrell. BTC prices turned lower soon after hitting new all-time highs, likely due to the volume of highly leveraged long positions, the increase in funding costs for leverage, and sell orders tethered to previous all-time highs. Regardless of the reason, selling action after hitting an all-time high “was not abnormal,” he said. Similar pullbacks occurred after BTC hit all-time highs in 2017 and 2020, but after breaking through the technical resistance in those instances, “we saw some pretty parabolic returns, and they happened quite quickly.”

Chart of the Week
What is FS Insight?
FS Insight is a market-leading, independent research boutique. We are experts in U.S. macro market strategy research and have leveraged those fundamental market insights to become leading pioneers of digital assets and blockchain research.

Tom Lee's View
Proprietary roadmap and tools to navigate and outperform the equity market.

Macro and Technical Strategy
Our approach helps investors identify inflection points and changes in equity leadership.

Deep Research
Our pioneering research provides an understanding of fundamental valuations and risks, and critical benchmarking tools.

Videos
Our macro and crypto videos give subscribers a quick and easy-to-understand audiovisual updates on our latest research and views.

US Policy Analysis
Our 40-year D.C. veteran strategist cuts through the rhetoric to give investors the insight they need.


