As the summer solstice approaches and 2019 closes in on the halfway mark, investors have already witnessed two opposing market regimes: equity gains reminiscent of the mid-90s (double-digit gains January to May) and a “tower of terror” decline (May to early June).
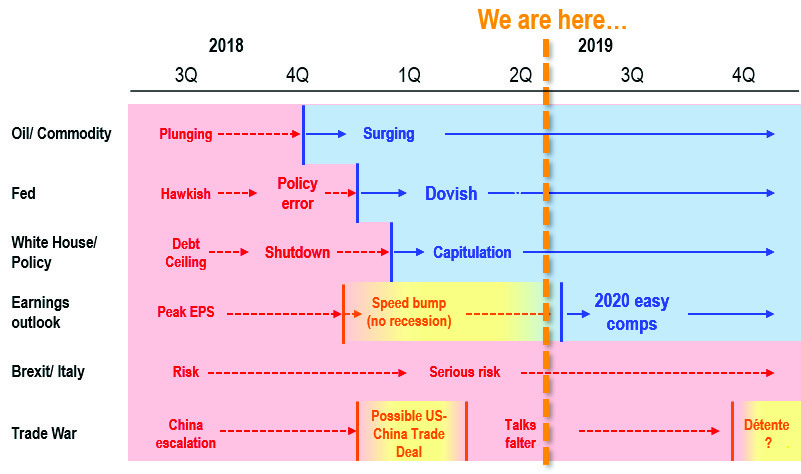
Multiple factors contributed to the roughly 8% decline from May highs to the early June lows,. Among them was a loss of visibility (hence, higher risk premia) as trade tensions escalated during a period in which the market was overbought (on many measures). Trade tensions continue to linger, and it is apparent that investors have become overly negative. That’s evident in several measures discussed below.
Coupled with what, in my view, remain resilient U.S. fundamentals and a supportive Federal Reserve, there is a backdrop for equity markets to build on gains into year end.
Tariff wars are scary, but investors are overstating the impact on the U.S. consumer, given volatility in consumer price index and the likelihood of substitution. The S&P 500 lost ~$2 trillion—that’s right $2 trillion—in market capitalization over the past 6 weeks on the heels of $64 billion tariff. That shows the tariff war hurt the S&P 500 index more than it hurt China (30 times the impact on equity vs China).
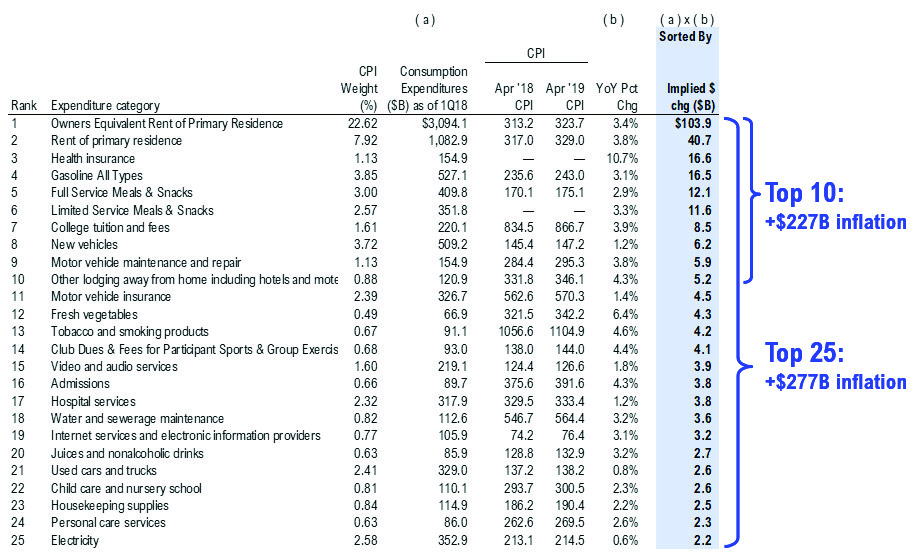
While loss of visibility is worrying, volatility in CPI is much greater than any $64 billion in increased tariffs. As shown in the table below, over the past year just the top 10 changes in CPI (past year) were $227 billion in increased costs for US households and top 25 were $277 billion (topping lists are rent, health insurance, gasoline, higher snacking costs). And even CPI declines offset tariffs to an extent—the top 10 drops in CPI components resulted in $32 billion in saving, including apparel, toys, eggs, etc.
The point of this is to highlight the complexity of a giant $20 trillion US economy means tariff impacts are much more muted in the grand scheme of things. Moreover, one has to remember the consumer is likely to substitute spending—of the $257 billion in goods impacted by Trump tariffs, the majority of substitutable purchases, not staples.
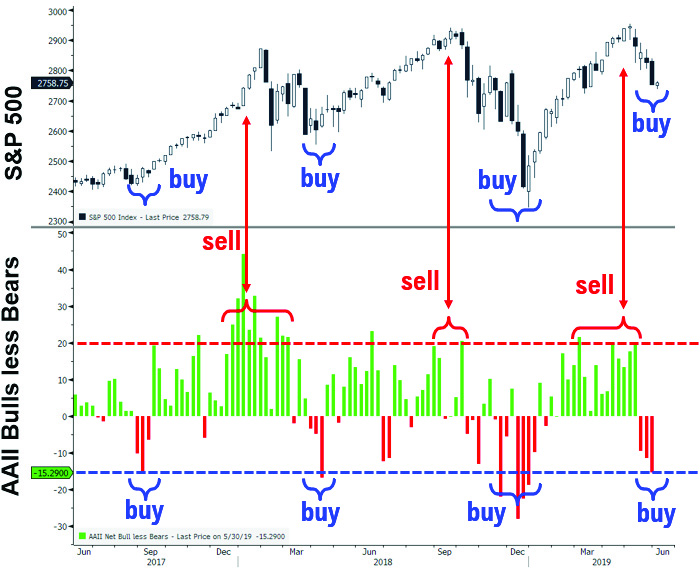
Investor skepticism is stretched to the downside as well. As many of our regular readers know, my favorite sentiment measure remains the American Association of Individual Investors percentage of bulls less bears. This measure showed 3 consecutive weeks of -10% or worse, the previous three of which—September 2017; March 2018, and December 2018—were major buying opportunities. (See chart at right.)
Such a cluster today, coupled with oversold readings of daily relative strength index, are telling us investors have become too negative. And this shift from neutral/positive in early May to negative occurred with lightning speed. That suggests investors never had high conviction to begin with (which is bullish for yearend).
I think tilting toward cyclical makes sense even as tariff wars linger. These stocks, in my view, look like the better bet at the moment. The 30-year to 10-year U.S. Treasury yield curve has been steepening continuously all year (even during trade tensions) and is highly suggestive of further outperformance of cyclicals, a sector that likes a curve steepening. Moreover, a stabilizing U.S. greenback is a potentially developing tailwind for the industrials sector. Healthcare, however, remains a somewhat challenging group given it is now in the political cross hairs.
What could go wrong? A lot, frankly. Yet these risks are apparent and more easily discounted by investors—escalation of tensions, Brexit, recession, etc. I believe the consensus narrative of late-cycle US is overly negative and that the country’s economy remains mid-cycle.
Bottom line: I view the most probable outcome in 2H 2019 is the S&P 500 index producing a substantial rally, with 3,125 my YE target. While investors remain skeptical and largely sidelined, stocks offer real return and yield. As I have noted in previous missives, US markets remain significantly more appealing than global markets.


