


VIDEO: Fed Chair Powell was decisively dovish this past Friday at Jackson Hole, solidifying case for small-caps. We discuss the upside case in this video
Please click below to view our Macro Minute (duration: 3:47)

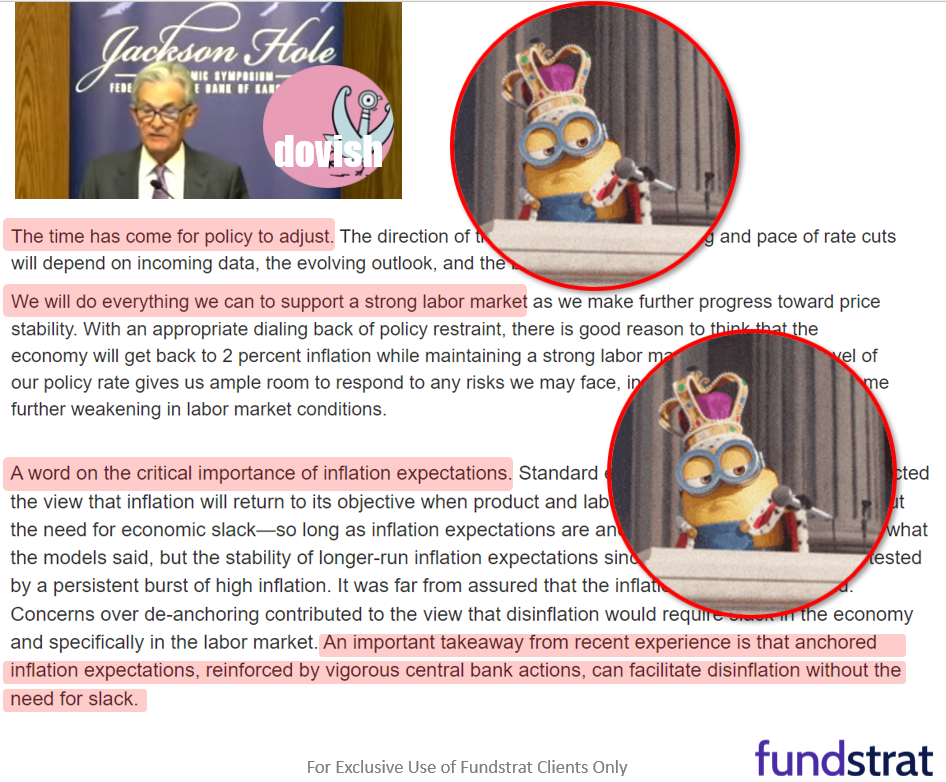
Fed Chair Powell gave a dovish speech this past Friday (8/23), affirming the Fed is set to begin an interest rate cutting cycle starting in September. As we discuss below, the case was made clear and Powell reiterated his support for a strong labor market (“soft landing”) while also noting how critical this has been that inflation expectations had remained anchored. Overall, to us, this is the return of the “dovish” Fed and has clear positive implications for small-caps:
- This is the most decisive Powell statement:
“The time has come for policy to adjust. The direction of travel is clear, and the timing and pace of rate cuts will depend on incoming data, the evolving outlook, and the balance of risks.” - Powell also supportive of strong labor markets aka “soft landing”:
“We will do everything we can to support a strong labor market as we make further progress toward price stability. “ - This latter statement should dispel those skeptical hawks who think the Fed wants to bring about a recession or will inadvertently bring about a recession.
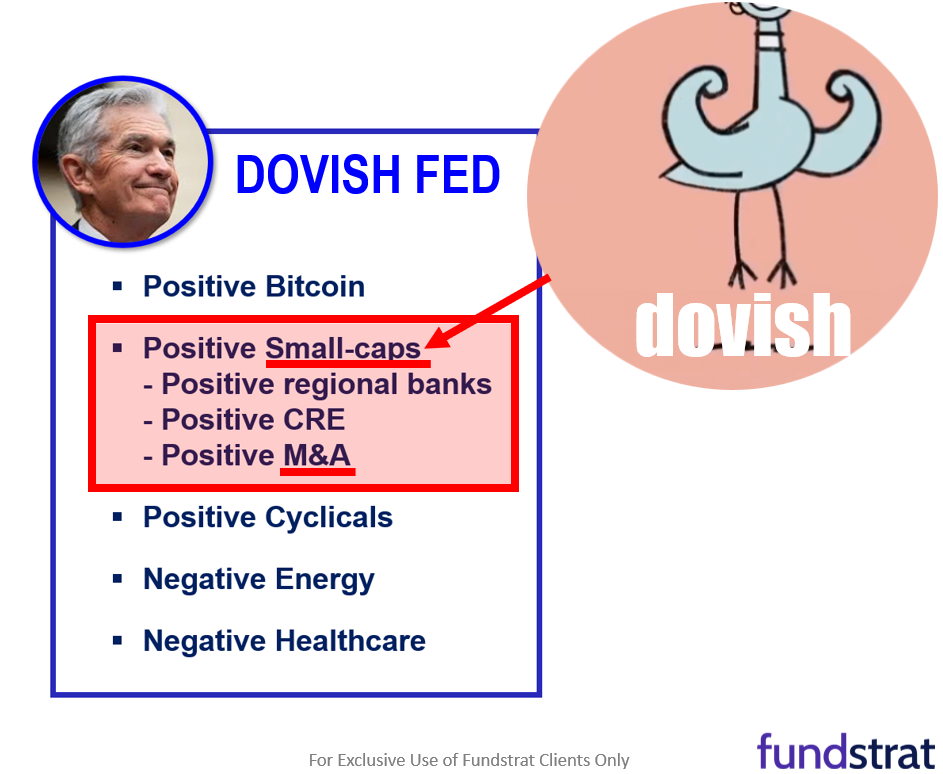
- All in all, this is as dovish a statement as one could have expected. And as we wrote about in the past, we believe the primary beneficiaries of a dovish Fed are:
– Bitcoin (easy money) BTC -7.25%
– Small-caps IWM -2.65%
– Regional banks KRE -1.20%
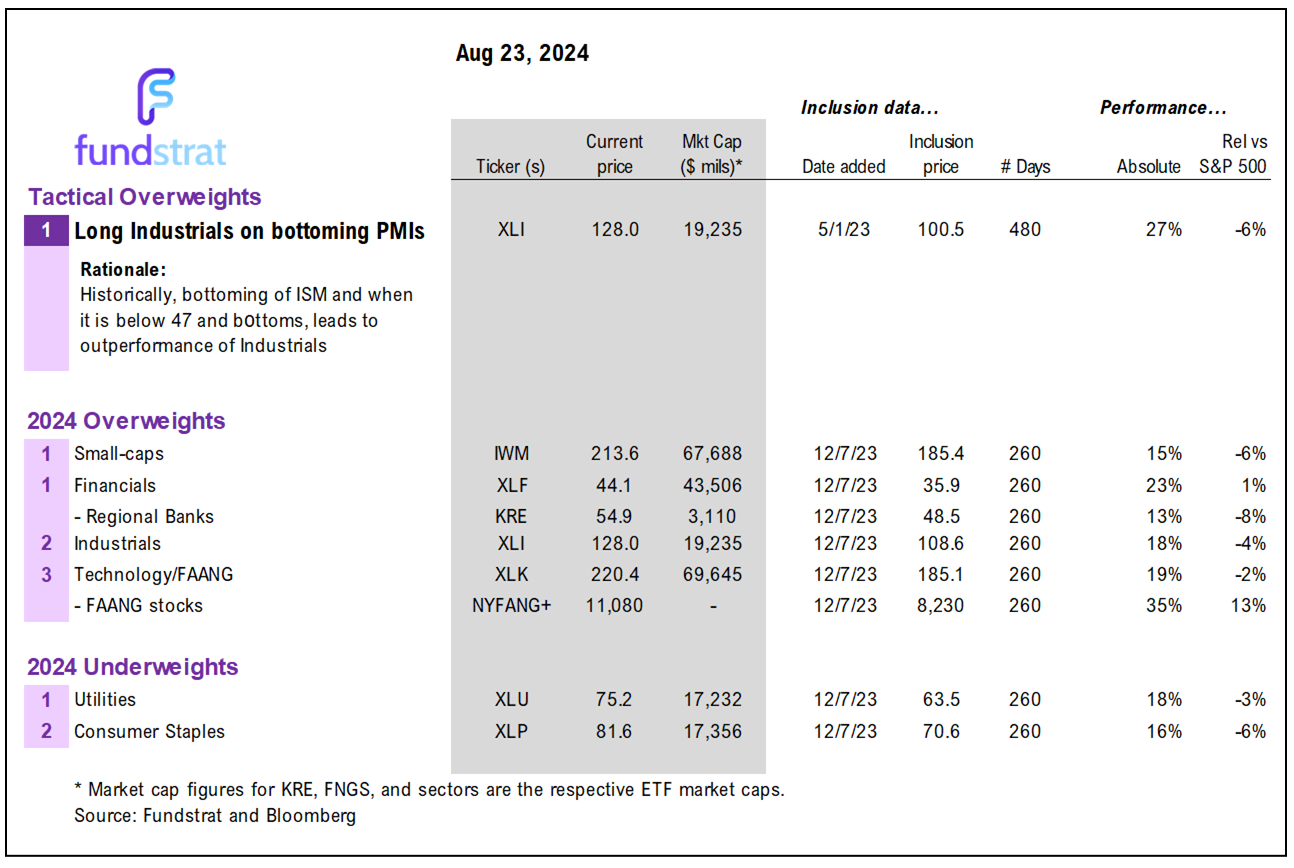
– Cyclicals XLI -1.55% and XLF -1.14% (Financials and Industrials) - The case for overweighting the above remains in place. However, of the above calls, we get the most resistance/pushback regarding small-caps. Many investors believe small-caps is chasing a higher risk opportunity.
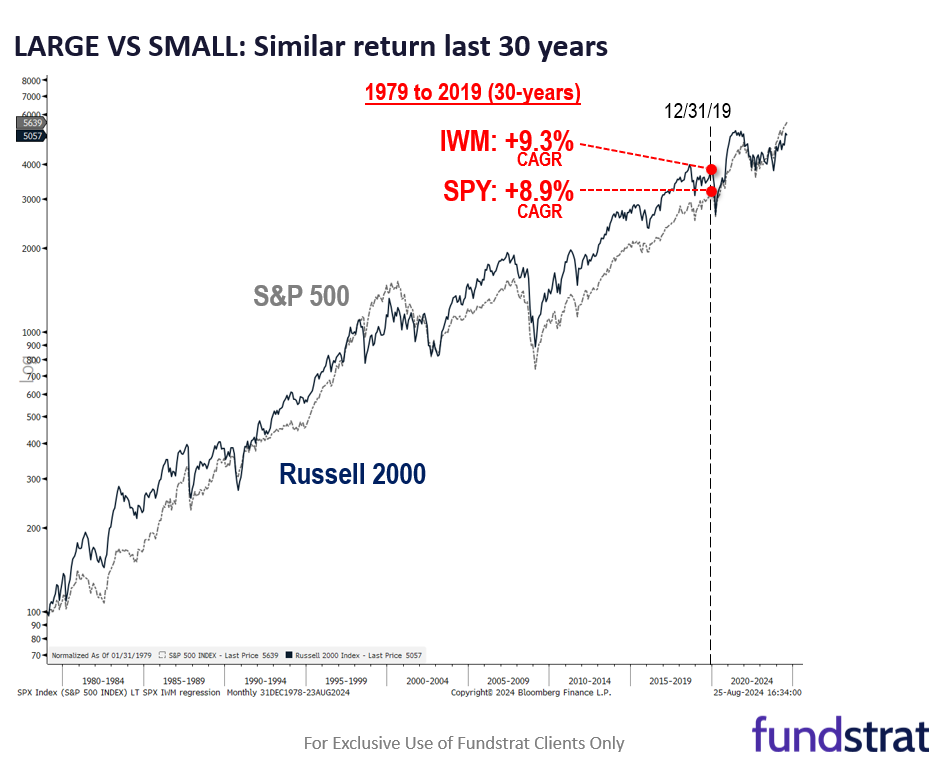
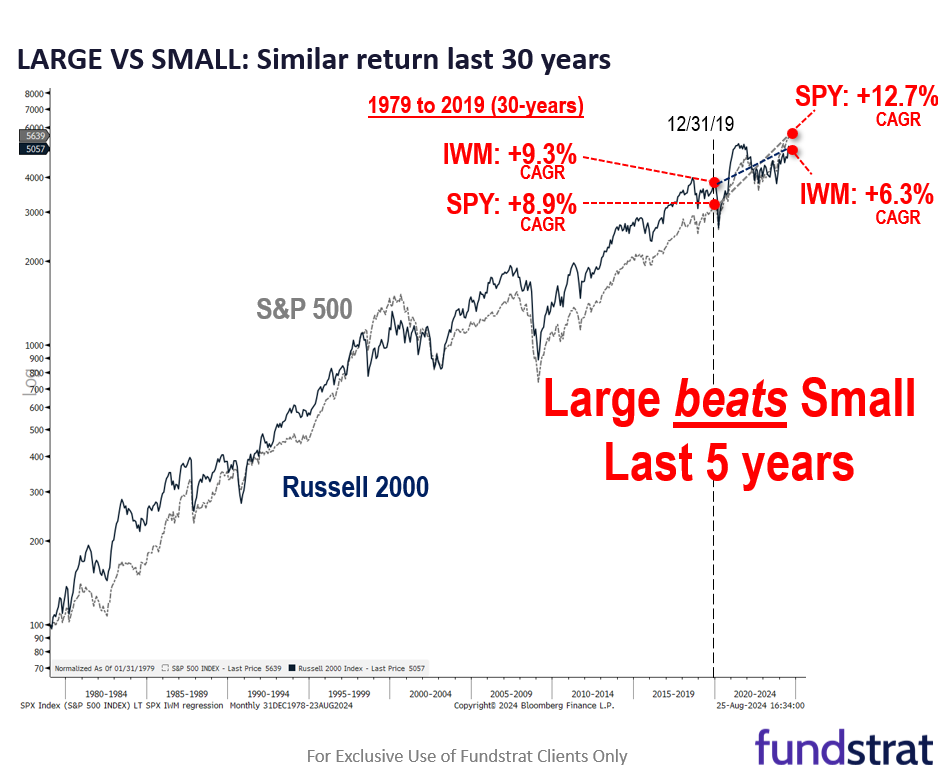
- In our view, this skepticism is largely borne out of recency bias. Small-caps have underperformed the S&P 500 in the past 5 years:
– S&P 500 12.7% 5-yr CAGR
– Small-caps 6.3% 5-yr CAGR - Yet this has not been the case for the past 30 years:
– 1979 to 2019
– S&P 500 8.9% 30-yr CAGR
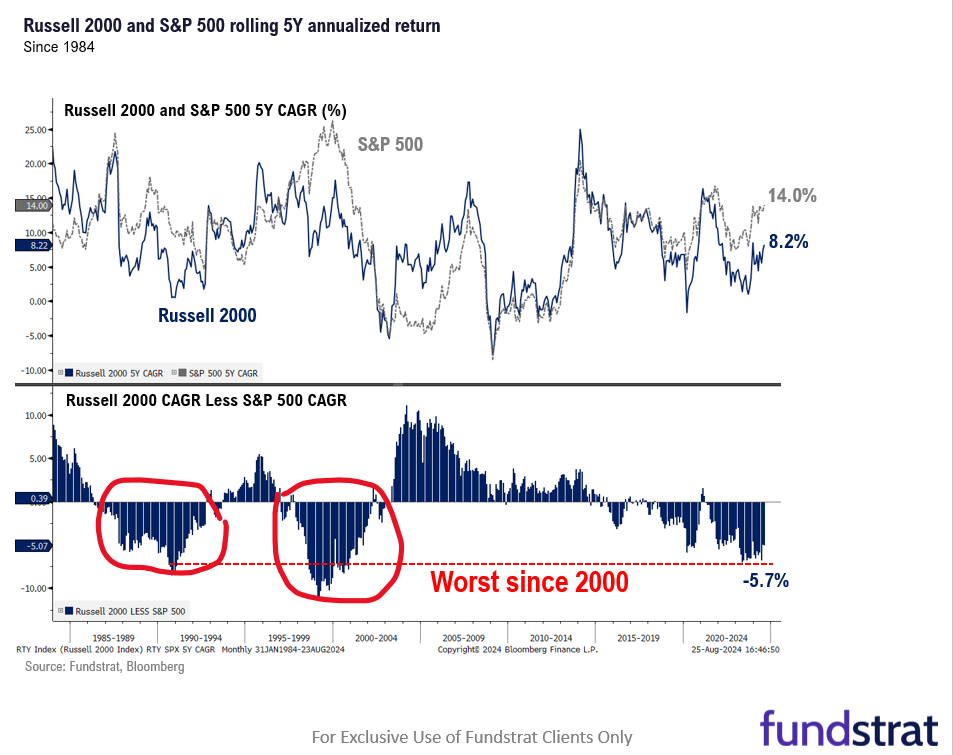
– Small-caps 9.3% 30-yr CAGR - See the difference? The last 5 years have been poor for small-caps but this was not the case for the past 30. Why the past few years?
– Fed has been very tight on monetary policy since 2021
– this has created disproportionate burden on small companies
– market liquidity has been poor as $6T sits on the sidelines - But as of today, small-caps are far more attractive:
– Median P/E ’25 10.7X IWM -2.65%
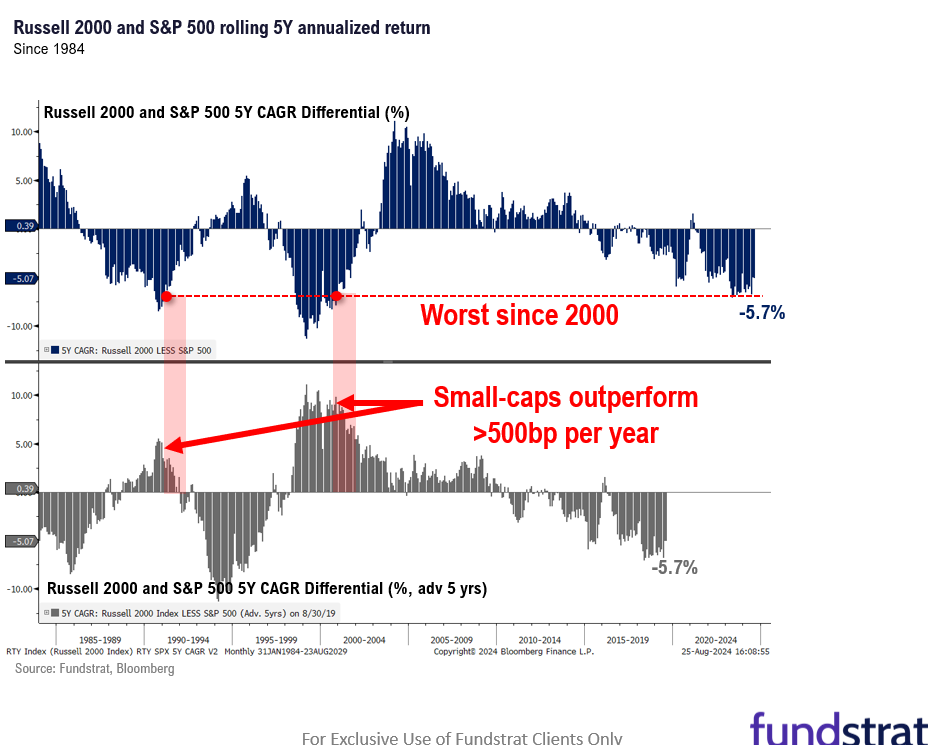
– Median P/E ’25 16.7X SPY -1.39% - This level of underperformance of small-caps was seen in the early 90s and early 2000s. And the interesting thing is the forward return of small-caps post such periods:
– 1992-1997 IWM -2.65% beat SPY -1.39% by 500bp per year
– 2001-2006IWM -2.65% beat SPY -1.39% by 800bp per year - See the point? The risk/reward is very attractive for small-caps here. So, please look beyond the consensus pushback.
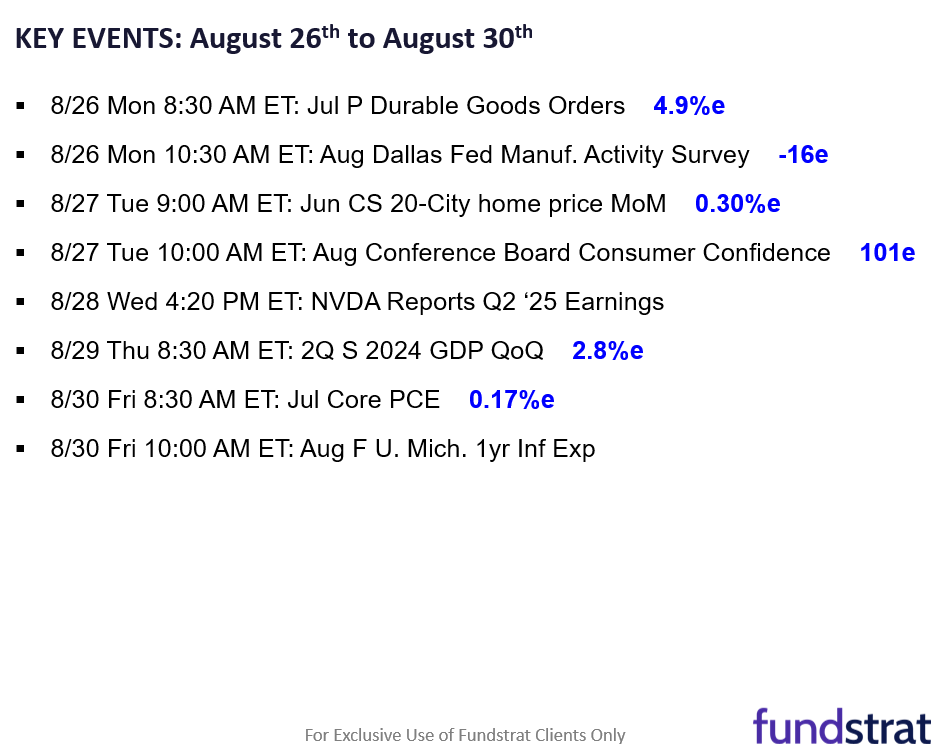
- There is a lot of key macro data this week:
– 8/26 Mon 8:30 AM ET: Jul P Durable Goods Orders 4.9%e
– 8/26 Mon 10:30 AM ET: Aug Dallas Fed Manuf. Activity Survey -16e
– 8/27 Tue 9:00 AM ET: Jun CS 20-City home price MoM 0.30%e
– 8/27 Tue 10:00 AM ET: Aug Conference Board Consumer Confidence 101e
– 8/28 Wed 4:20 PM ET: NVDA Reports Q2 ‘25 Earnings
– 8/29 Thu 8:30 AM ET: 2Q S 2024 GDP QoQ 2.8%e
– 8/30 Fri 8:30 AM ET: Jul Core PCE 0.17%e
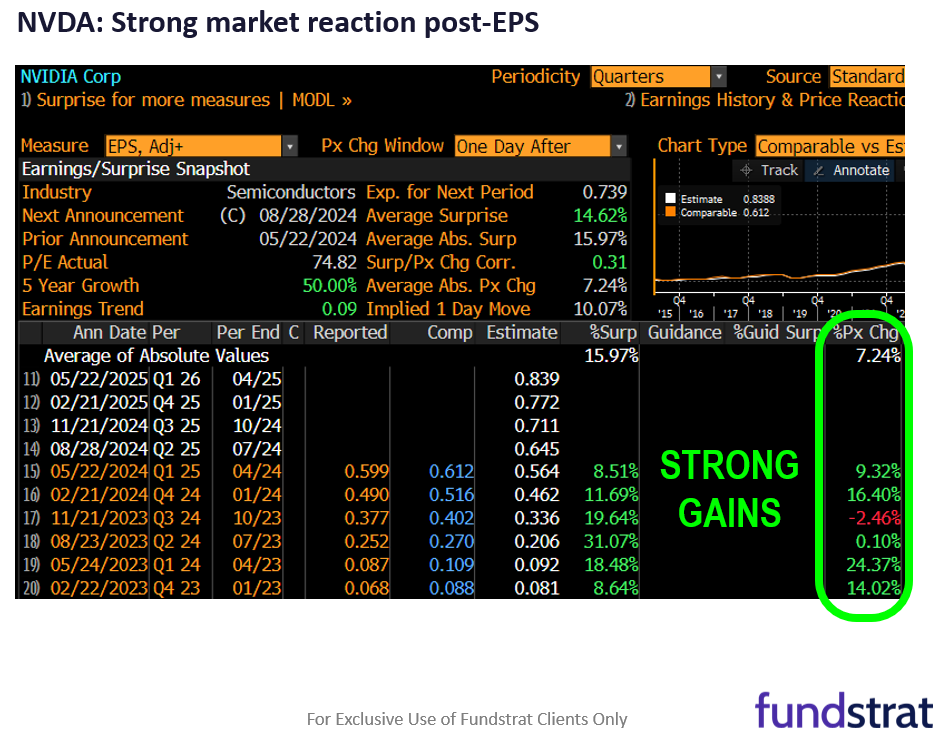
– 8/30 Fri 10:00 AM ET: Aug F U. Mich. 1yr Inf Exp - Of these, the two in focus are likely NVDA -3.45% earnings (8/28) and July Core PCE (8/30). As we noted earlier this month, NVDA tends to see positive reaction post-EPS:
– 5-day return post-EPS
– 2/22/23 +14%
– 5/24/23 +24%
– 8/23/23 +0.1%
– 11/21/23 -2.5%
– 2/21/24 +16%
– 5/22/24 +9%
BOTTOM LINE: Evidence growing that equities made their summer lows on 8/5.
Generally, August to October is a tough period for markets. One important client, ES of NY, has repeatedly mentioned to me “I never make money in August.” And that is consistent with the view of Mark Newton, Head of Technical Strategy, that Aug to Oct is window where stocks’ risk/reward is less attractive than the period post-election.
- Since 1928, however, of that period between August to October, the S&P 500 has bottomed most commonly during August.
– August, Sept and Oct low %: 44%, 17%, 40%
– meaning, markets most likely bottom in August (for that period) - Guess what is the most common week for the bottom?
– the first week of August
– 15 of the 96 years - Lastly, we need to be mindful that Iran could launch an attack this week, in response to several high profile assassinations. The Olympics ended August 11. So, markets are naturally wary of the headline risk from this. But we know the adage:
– “sell the build-up, buy the invasion” - The only thing is that at the start of the Russia-Ukraine war, markets had a short relief rally. But that war has since become a larger and most costly conflict. So, problems percolating in the Middle East are not to be taken lightly.
- But just because markets might have some headwinds near term does not change the probabilities of a strong second half. As we noted previously:
– Since 1950, when S&P 500 is up >10% in the first half
– 23 instances
– 2H (second half) gains +9.8%, 83% win-ratio
– the 4 negative 2H instances were 1975, 1983, 1986, 1987
– essentially, all the negative 2H were during Volcker era
Bottom line, markets are certainly showing strong signs of gaining their footing. And we also view this panic as ultimately being a growth scare (coupled with a carry trade unwind).
_____________________________
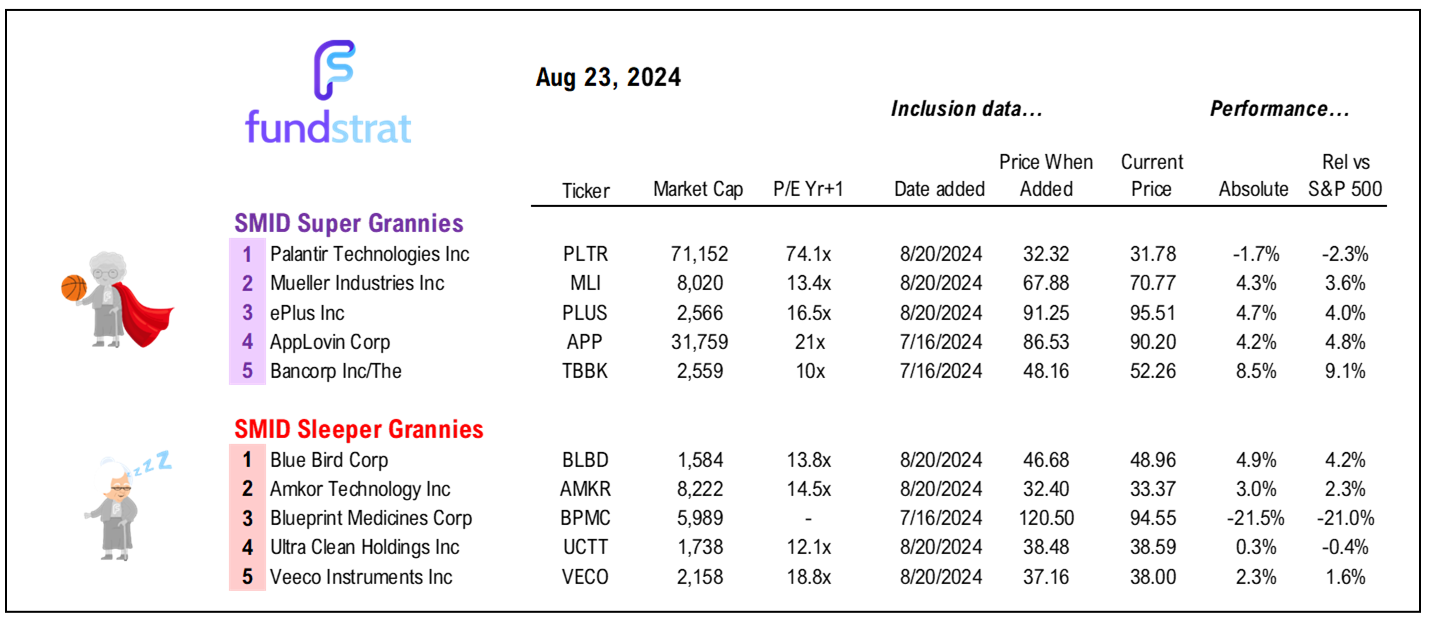
42 SMID Granny Shot Ideas: We performed our quarterly rebalance on 7/16. Full stock list here -> Click here
______________________________
PS: if you are enjoying our service and its evidence-based approach, please leave us a positive 5-star review on Google reviews —> Click here.
___________________________


