


COVID-19 remains a global crisis and we realize that many people need to keep up with COVID-19 developments, particularly since we are moving into the more critical stage (“restart economy”), so feel free to share our commentary to anyone who has interest.
CBS 60 Minutes aired an interview by Scott Pelley with Federal Reserve Chairman, Jay Powell (transcript link –> 60 Minutes interview). It was a wide-ranging interview, but two things really resonated us:
– first, Powell’s statement “we’re not out of ammunition, by a long shot”
– second, when asked what he is watching, he responded “the thing that matters the most is the medical metrics”
This pretty much lines up with our thinking. Don’t fight the Fed (just like we can’t fight City Hall). I was surprised to hear him relay that medical metrics matter the most. This has been our take. That we need to track the progress of the disease to be informed about the investment roadmap. And of course, this is logical. But we do not hear this often when people are commenting on their economic outlook.

This statement is really the key statement from the interview. The Fed is not out of ammunition and there is no limit.

https://www.cbsnews.com/news/full-transcript-fed-chair-jerome-powell-60-minutes-interview-economic-recovery-from-coronavirus-pandemic/
And again, Powell’s statement below really strikes home the need to track the path of the disease spread, primarily in the US, in order to have an informed view about financial markets. In this commentary, we also highlight how McKinsey’s most recent small business survey shows small businesses are doing better than I expected. It is dire, but ~46% are saying they are affected by COVID-19, down from 49% last month, and I would have expected this to be 75% or higher.
https://www.cbsnews.com/news/full-transcript-fed-chair-jerome-powell-60-minutes-interview-economic-recovery-from-coronavirus-pandemic/
States are increasingly easing restrictions and even CT, the first of the NY tristate regions, plans to lift a substantive amount of restrictions on 5/20/2020 (this coming week). So far, there has not yet been evidence of a second wave taking place in any state. Rather, the early reports of case increase still fall into that weekly cadence of lumpiness.
One thing I have started to wonder is whether the US or any country can actually get cases to fall to zero. Of course, with a vaccine, this will happen. And secondly, whether this is a realistic policy goal. If effective treatments are developed, then achieving zero will also be less important.
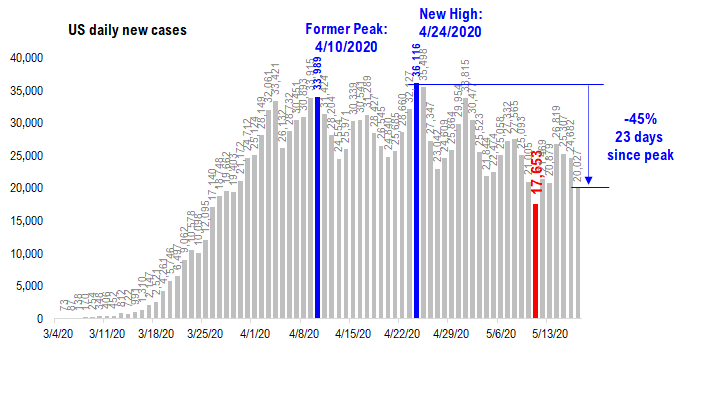
POINT #1: Total US daily cases at 20,027 (generally lower over the weekend) and US daily deaths fall to a new low of 805 (peak was 2,685 on 4/21/2020).
Daily cases tend to be volatile over the weekend…
Daily COVID-19 cases see some volatility over the weekend, reflecting testing lags and laboratory office hours. But the reported daily cases for the past 2 days is lower than the Friday reported figure of 25,307. So at least the trend is not negative.
– The 20,027 daily figure is -45% from the peak of 36,116 seen 23 days ago on 4/24/2020.
Source: COVID-19 tracking project
KY and ID did not report any case data today…
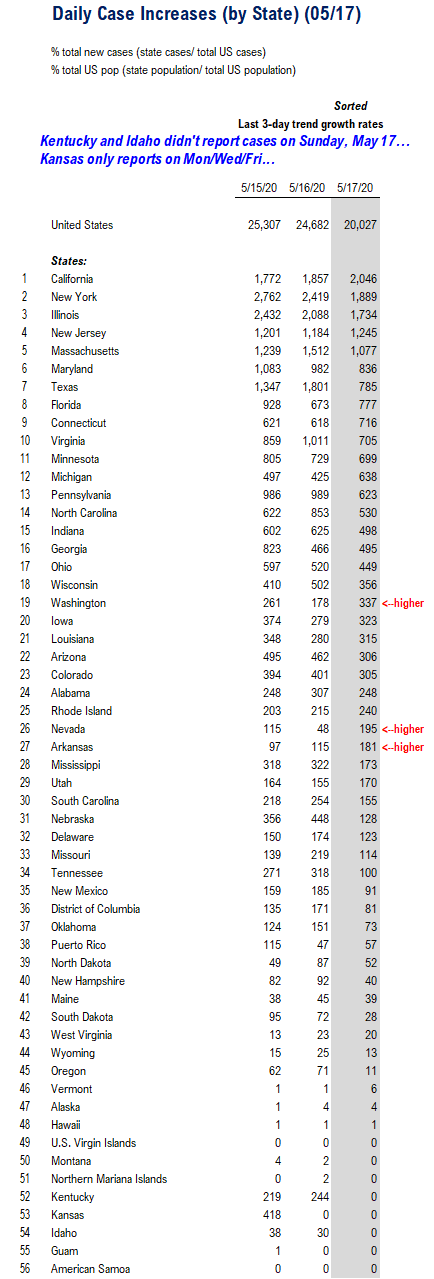
Looking at the state level, two states did not report case data today, KY and ID. These are not the states with major breakouts, so their lack of reporting is not necessarily adding a lot of distortion. We think looking at the 2D change may make more sense, so comparing Sunday to Friday’s numbers.
Total US cases are down -5,280 over the past 2 days (1D changes). 32 states reported fewer daily cases vs 2D ago, so the drop is widespread. But 5 state account for half of this decline:
New York 1,889 vs 2,762 (2D ago) -873
Illinois 1,734 vs 2,432 -698
Texas 785 vs 1,347 -562
Pennsylvania 623 vs 986 -363
Georgia 495 vs 823 -328
Total 5 states -2,824 (53% of decline)
The encouraging statistic is states that have largely opened up, including TX, GA (above), OH (-148 2D) and FL (-151 2D) have not reported any surges in cases.
Source: COVID-19 tracking project
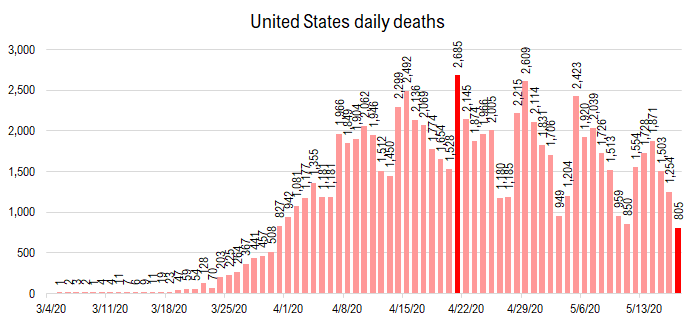
Daily deaths fall to 805, down ~30% from peak daily deaths of 2,685…
Daily reported deaths are volatile, and understandably so. The mortality of a patient is not a function of time, but rather when that person’s body succumbs to the disease. But the trend in daily deaths is generally falling. The chart below highlights the 7-day cycle of deaths. That the fewest seem to be reported on a Sunday. And as such, we would only note the 805 is lower than the 959 reported a week ago.
Source: COVID-19 tracking project
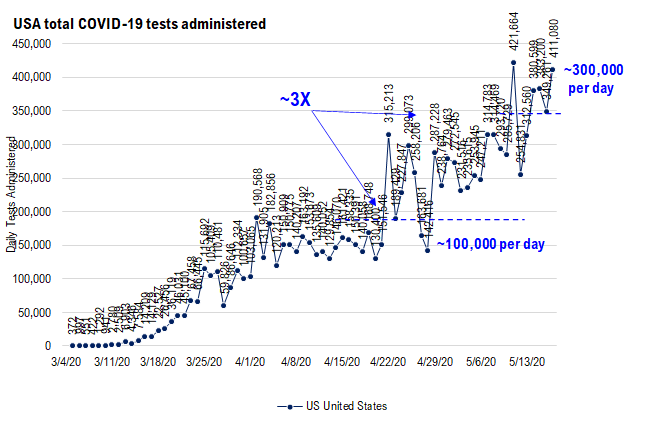
Testing is rising and was >400,000 on 5/17…
And tests administered remain at >400,000 per day. And as the chart below shows, this level of tests was higher than any day last week. So the drop in cases to 20,027 is not due to fewer tests administered.
Source: COVID-19 tracking project
NY Gov Cuomo is encouraging residents to get tested and even had a COVID-19 test administered on live TV. The test requires a nasal swab and as the photo shows, this is very long swab. And because the technician needs to be close, there test requires the use of a lot of protective equipment.

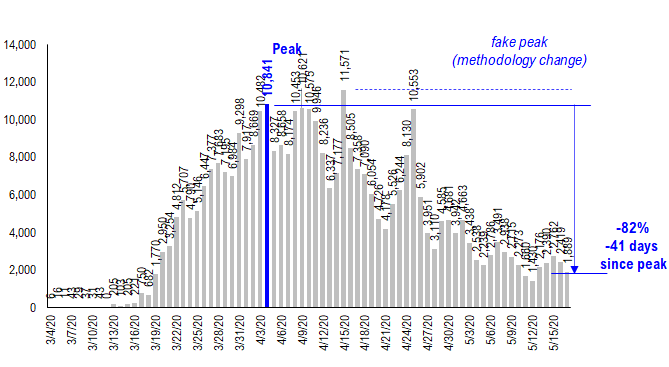
NY state reported cases were relatively flat over the weekend, with 1,889 cases reported. This figure is down 82% from the high reported 41 days ago. The state eased restrictions on 5 regions of the state over the weekend. But NYC and Westchester-are, and NYC metro area remain under the stricter stay-at-home restrictions.
Source: COVID-19 tracking project
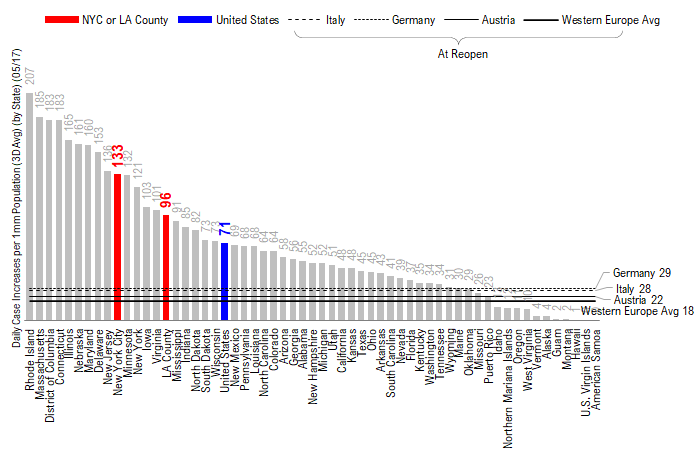
POINT #2: US daily reported cases (cases per 1mm) are still high relative to Europe on their re-opening dates.
When we track and analyze COVID-19, we mostly refer to the absolute number of daily cases. But when it comes to comparing the US experience versus other nations or even comparing states, it is helpful to look at a “common-sized” metric by looking at daily cases per 1mm residents.
Rhode Island, Massachusetts, DC, IL and CT report the highest number of daily cases/1MM residents…
We compiled the daily cases (common-sized) and sorted by highest to lowest. The US overall is at 71 and we also added NYC and LA county below.
– the 5 states with the highest daily cases/1mm are: RI, MA, DC, IL and CT (ok, DC is technically a district).
– NYC at 133 is now below NJ and would rank #11 overall. LA County is at 96 cases/1mm.
I am surprised to see RI and MA with among the highest daily reported cases/1mm residents and even CT. CT is planning to ease restrictions this coming week. But as we commented in prior FLASH, nursing homes are the epicenter of the crisis for CT.
Source: Various country health dept and COVID-19 and US health departments.
Source: Various states and Fundstrat
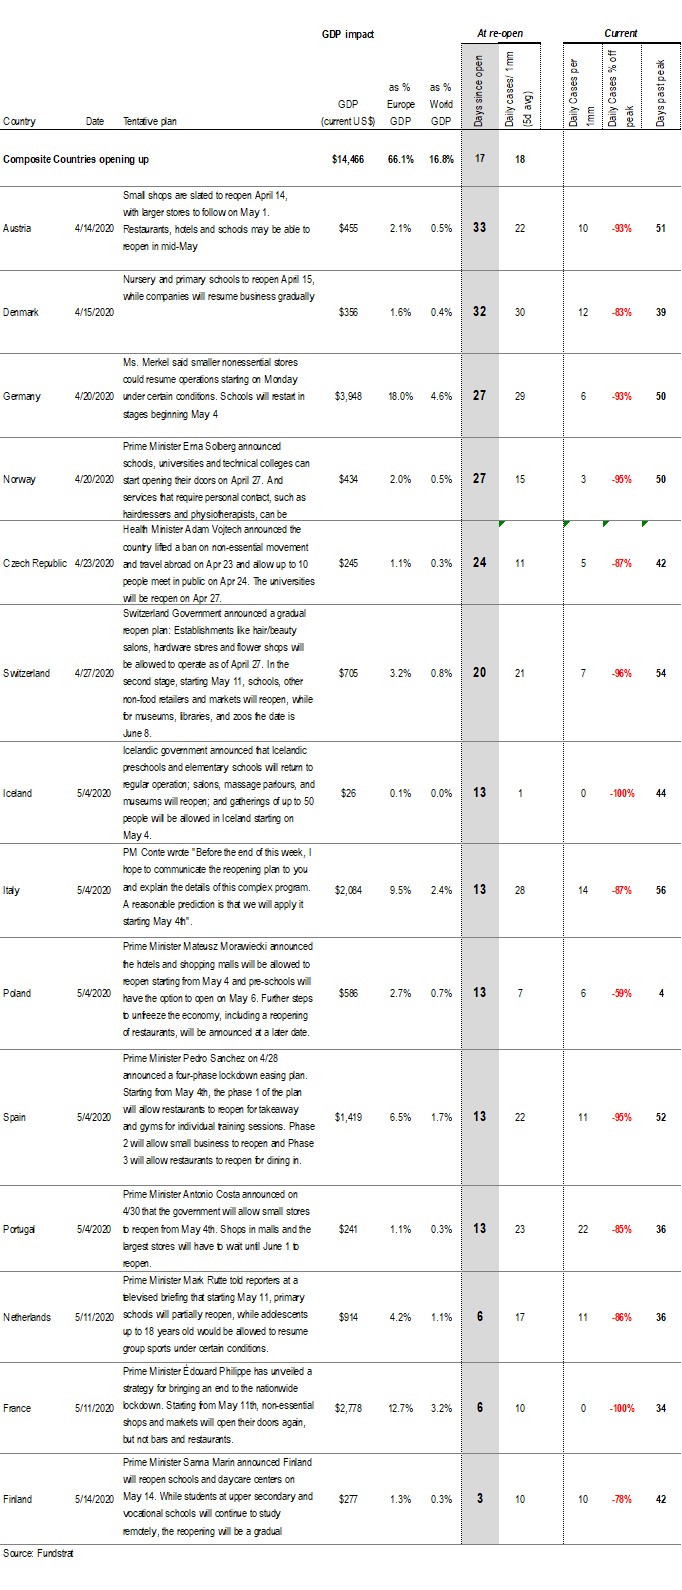
But Western Europe averaged 18 daily cases/1mm residents at open…
We also marked the levels of daily cases when Europe opened (composite of 14 nations) and that figure is 18. Only 7 state in the US have daily cases <18 per 1mm residents:
Idaho 18
Oregon 11
West Virginia 10
Vermont 4
Alaska 4
Montana 2
Hawaii 1
Georgia, which has been open for >3 weeks, has daily cases of 56/1mm residents. And Texas is better at 45.
US cases need to fall another 75% to around 5,000 per day to match Europe’s 18 daily cases/1mm residents…
To match Europe, US cases would need to fall to 5,000 per day (~18 cases/1mm residents). The obvious question is why has Europe been able to see a much steeper decline in cases compared to the US? There are several reasons for this, but we are not sure how to attribute this to each respective factor:
– Europe stay at home restrictions led to a much greater reduction in mobility
– US cases have been particularly widespread in nursing homes (but nursing homes at ~25% of cases)
– US was somewhat slower in introducing stay-at-home orders and was done on a state by state basis, while interstate travel continued
This is not really an adequate answer. And we will ask our data science team for insights, led by tireless Ken.
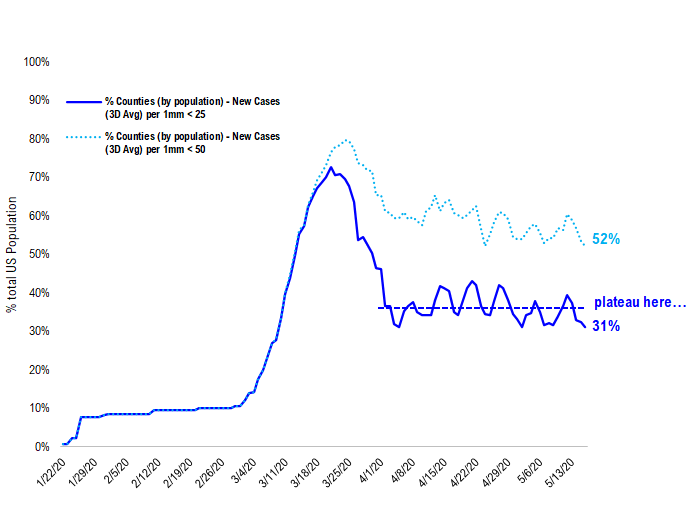
US counties with daily cases <25/1mm residents has “flat-lined” at 31%… not improving much
Below is a chart showing the % of counties (based on population) with daily cases <25/1mm residents. This is a rough comparison to the levels seen in Western Europe before their opening.
– One thing we are somewhat puzzled by is the “flat-lining” of counties at the 31% level currently.
– Even counties with daily cases <50/1mm residents ha also been stubbornly around 52%
This could simply be lagged and we could see improvements in the coming weeks. But the future is uncertain. And we will be watching this closely.
Source: various state health dept, Fundstrat and Johns Hopkins
POINT #3: Not a “normal” business cycle — nearly record issuance in both high-yield and investment-grade markets contrasts with dire contemporaneous economic circumstances…
Credit markets are seeing strong “inflows” and issuance YTD is going to be an all-time record…
High-yield debt markets are close cousins of equities, given the riskier nature of the debt (below investment grade) and over the past 30 years, HY has delivered 80% of the return of stocks with half the volatility. So equity and HY tend to move in tandem, and developments in HY tend to inform us on the direction for equities.
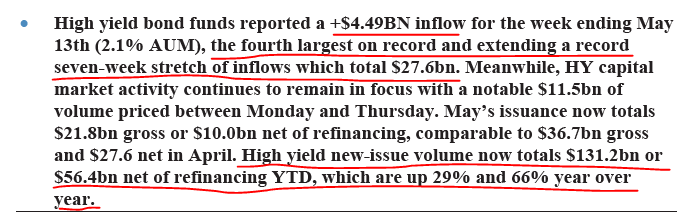
– JPMorgan Credit Strategists, in their most recent weekly commentary, have noted +$4.5 billion of inflows into HY (4th largest on record, and a 7-week total of $27.6b). Positive inflows into HY show a healthy appetite for HY debt.
– HY issuance net issuance is +$56.4 billion YTD, up 66% vs 2019.
Source: JPMorgan Credit Research
These are healthy figures. And we realize many may dismiss this and simply say the Fed is buying everything, so prices reflect that. This is true to an extent, but given the elevated credit risk in HY, and the fact that spreads have inched higher, the sheer strength of inflows and issuance, show there remains strong demand for HY bonds. We believe this also implicitly show investors are comfortable with the current fundamentals.
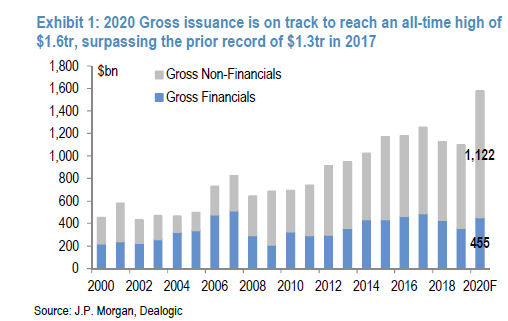
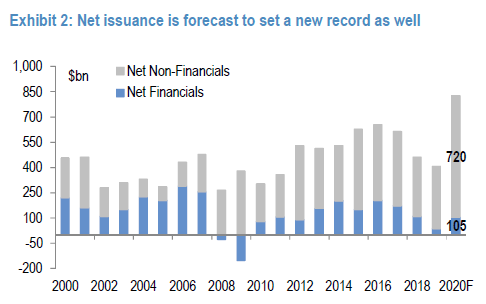
Investment-grade issuance is on track for $1.6 trillion gross, $825 billion net, the highest ever on record…
The demand for investment-grade bonds is equally strong. JPMorgan’s IG (investment grade, aka high-grade) team forecasts total issuance in 2020 of $1.6 trillion (gross) and $825b (net). The debt markets were actually shut down early in this crisis and for 11 days, no companies were able to issue primary debt.
And this shut down of credit issuance contributed to the equity’s market panic in March. This makes sense. Debt markets are the lifeblood for businesses, and when they are shut down, this inevitably elevates the risk of a credit accident. But in the ensuing weeks, thanks largely to the actions of the Fed, liquidity has returned to credit. But the level of issuance and activity is on track for the highest levels ever.
Source: JPMorgan Credit Research
Source: JPMorgan Credit Research
More than anything, this reminds us this is not a normal business cycle.
After all, in the midst of depression (which is where we are) and with >20% UE rates and PMIs<50, the IG and HY markets are wide open.
But perhaps underlying fundamentals could also be holding up. Yes. Take a look at the results of the latest McKinsey small business survey.
McKinsey just published an update to its US small business survey, and while dire, not as dire as we expected…
McKinsey published the updated survey and they note that small businesses report tremendous uncertainty (no surprise) but that sentiment is plateauing in recent weeks (positive). The content of the survey shows businesses are indeed suffering, but we were surprised the survey is not showing worse results.

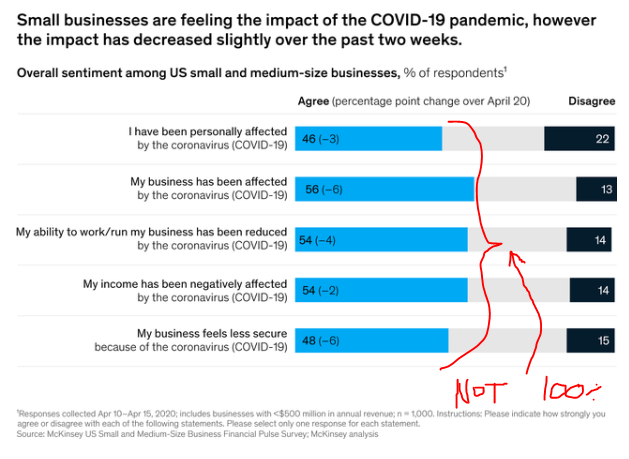
Only ~46% of small businesses are “personally” affected by COVID-19 and this figure is DOWN from last month…
The biggest surprise is the survey answers to this question. About 46% of respondents are personally affected by COVID-19 and this is down -3% from last month. Given the entire country is essentially under stay-at-home and given the millions of American unemployed and the decimation taking place in the hospitality sector, we are surprised the overall figure is only 46%.
– this figure was 49% last month, which again, is under 50%.
Small businesses are perceived to be bearing the brunt of the economic shutdown. So I am surprised, I would have expected this figure to be 75% or higher. If only 50% of small businesses are personally affected, I wonder what the percentage is for large and medium businesses, presumably smaller.
Source: https://www.mckinsey.com/industries/financial-services/our-insights/tracking-us-small-and-medium-sized-business-sentiment-during-covid-19?cid=other-eml-alt-mip-mck&hlkid=468e0537035d4c2fa94ec516ddd4626f&hctky=9489327&hdpid=9750fdd3-6c02-43c7-8919-1002eaea49a6
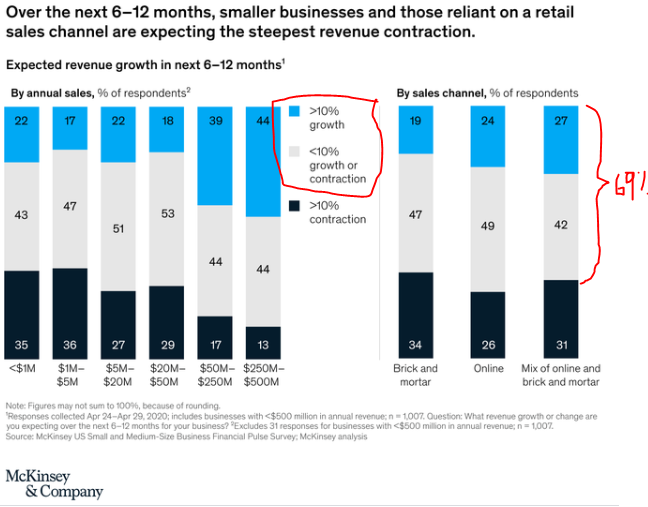
And over the next 6-12M, 69% expect sales to be higher, with 27% expecting >10% growth…
There are also better sales expectations as well. A surprisingly higher % expect sales to be higher in the next 6-12M at 69% and of this, 27% expect sales to be >+10% higher.
For comparison, many of those commentaries about the economy on media, twitter or on blogs, talk about an apocalypse for small business. And yes, the US economy is on life support (given forced stay-at-home orders). But small business owners seem to be faring better than suggested by the headlines.
Source: https://www.mckinsey.com/industries/financial-services/our-insights/tracking-us-small-and-medium-sized-business-sentiment-during-covid-19?cid=other-eml-alt-mip-mck&hlkid=468e0537035d4c2fa94ec516ddd4626f&hctky=9489327&hdpid=9750fdd3-6c02-43c7-8919-1002eaea49a6
STRATEGY: There is still a lot of cash on the sidelines…
Money market assets at $4.8T are an all-time high, both record for institutions and retail… hardly a bullish stance by investors
The S&P 500 has managed to retrace 50% of its losses (Feb highs to 3/23/2020 lows) and as we have noted in recent comments, at 2,834, the S&P 500 is sitting between two key retracement levels 50% (2,794) and 62% (2,934). Given the >30% rally from the ~2,200 lows, we realize investors have the impression a lot of firepowers has been used up as investors chased this rise.
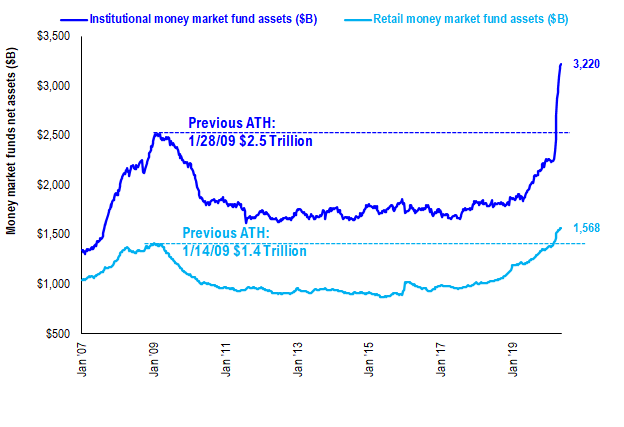
But this is not what has happened, surprisingly. Money market assets are at all-time highs, totaling $4.8T, of which ~2/3 is institutional.
– Total institutional money market assets are at $3.2T, exceeding the previous all-time high (ATH) of $2.5T on January 28, 2009.
– Total retail money market assets are $1.57T, exceeding the prior ATH of $1.4T on 1/14/2009.
In other words, this is a lot of dry powder on the sidelines.
Source: ICI
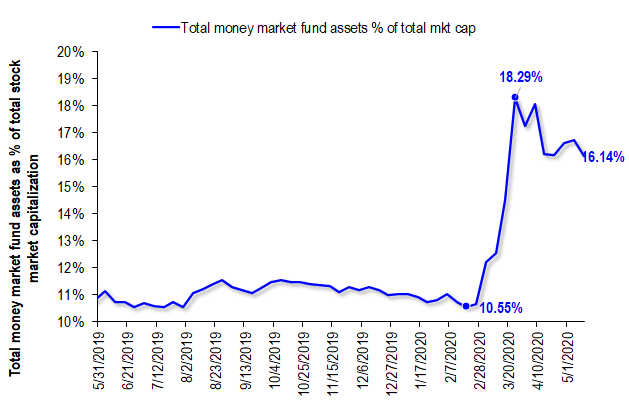
Money market assets only retraced 28% of the rise in balances vs >50% retrace for S&P 500… could be next catalyst
This total amount of money market assets is 16% of the equity market cap. This is down only modestly from 18% on 3/20/2020 and was 11% at the market highs.
– The S&P 500 has retraced >50% of its losses (at 2,864)
– Money market assets only retraced 28% of its increase in balances.
In other words, stocks have managed to claw back half its losses, even as cash balances have barely declined.
This is positive for risk/reward. And especially if the Fed is “not out of ammunition”
Source: ICI