


Stocks broke a pattern on Wednesday, managing to post 2 successive days of gains, something not seen since February 28th. And generally reinforces our belief that the “structural bottom” for stocks was registered last week (ala Oct 2008) and affirmed by Tom DeMark’s comments to our clients on Tuesday that “bulk of the downside is behind us…but we might trade sideways for awhile”
“markets bottom on bad news, not good.”
We realize freakishly bad economic data is coming. On Thursday, some economists are projecting weekly jobless claims to surge to as high as 5 million. Many of our more active and tactical clients are short into this, arguing that such wildly bad news cannot be discounted and thus, this “tape bomb” should lead to a big sell-off.
#1. So the first test will be jobless claims on Thursday.
#2. The next will be the earnings season which starts at the end of next week. The fact is, S&P 500 EPS will be distorted by “depression economic conditions”
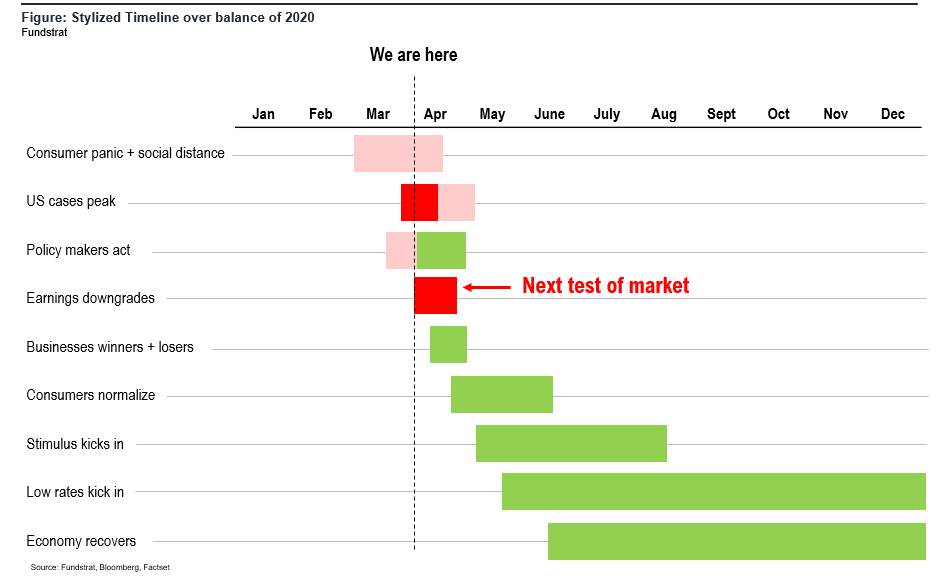
But as shown below, as we move into April, the cadence of incoming news and data will likely turn positive.
If such is the case, equity markets should be bottoming soon. In fact, as we highlighted in our FLASH from Monday evening/Tue AM, the 50% retracement of a decline generally only take 0.5X as long as the decline. This is true of the 10 30% declines since 1920. This implies we could be back to 2,800 by mid- to late-April. That is food for thought.
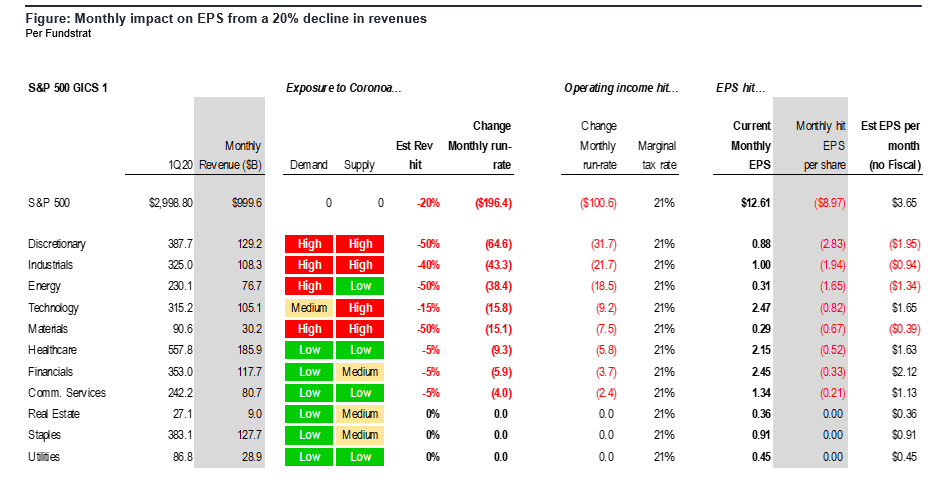
POINT: S&P 500 Monthly EPS run-rate is probably down to $4/month given the heart attack of the economy
We published our estimates for 2Q2020 (1Q2020 reported next week) and we believe that S&P 500 monthly EPS has fallen from around $13/month to as little as $4/month because of the massive stoppages.
– But we argue this should be not the basis to apply a 15X multiple. That is silly. A 15X P/E means investors are paying for 15 years of earnings. The sum of the next 60 quarters for S&P 500 EPS (7% CAGR) is $4,890. Thus, at 2,500, the S&P 500 is valued at exactly half the value of EPS for the next 15 years.
POINT: Some early signs “social distancing” working in New York City — looks like linear growth not exponential
Eyes were on Italy over the past few weeks, as it was the first developed nation to see an outbreak and in fact, is the template and roadmap for the US response. And fortunately, Italy looks like total cases indeed peaked on March 21, 2020 (4 days now) and 12 days after instituting stricter quarantine measures.
But New York City is now ground zero. New York State itself has so many cases, that nearly one-third of all COVID-19 tests are in this state. But the city and the state instituted fairly strict social distance measures for some time.
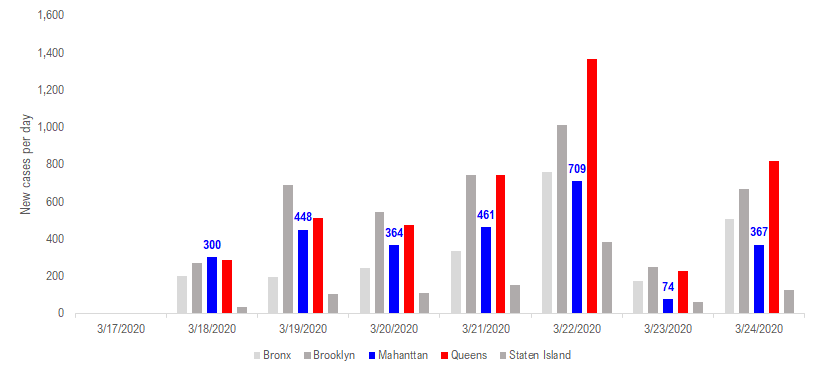
We have compiled “daily new cases” for the 5 boroughs below. Highlights in blue is Manhattan and red is Queens. We only have this data from 3/18/2020 to 3/24/2020 (7 days). But a few notable observations:
– # total new cases in Manhattan was 300 on 3/18/2020 and as for 3/24/2020, # total new cases is 367. About FLAT for the past week.
– Think about that. If cases are doubling every 3-4 days, we should have seen 1,200 daily new cases by 3/24/2020.
– In other words, instead of being an exponential rise in cases, daily cases in Manhattan are linear (flat arguably).
This is pretty good news, in our view, because this suggests that measures like social distancing are leading to a much flatter curve. Think about that. Instead of 1,200 cases per day, which was projected, it has stayed around 300-ish per day.
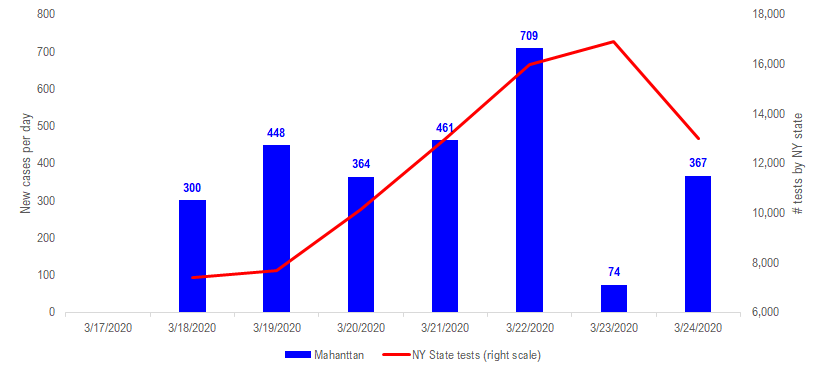
Now you might wonder if this is because there is less testing. The opposite is true. We do not have the # test for New York City alone, but we do have it for New York State.
– New York State tests went from 8,000 on 3/18 to around 12,000-14,000 per day.
– With a 50% increase in tests, the number of New York City cases is roughly flat.
This argues further that cases are not growing exponentially in New York City. This could obviously change with a super spreader. And given the incubation periods. But this is still not a bad data point.
We will chalk this up as another “glimmer of hope.”
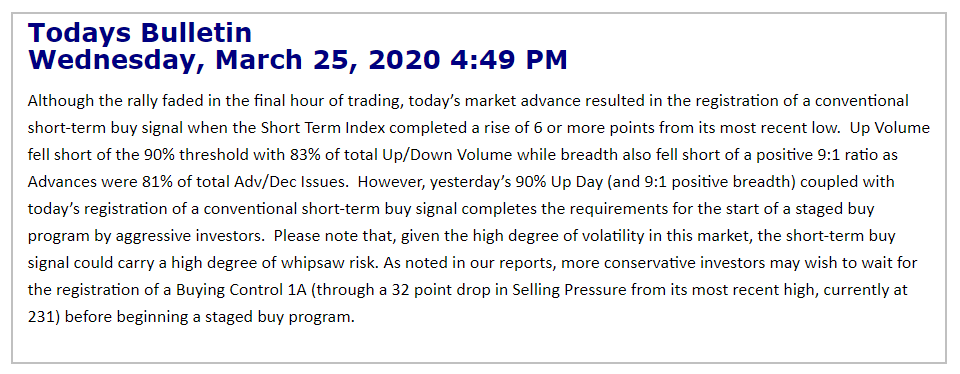
POINT: Lowry’s now registered a 90% “up day” Tuesday and an 80% “up day” Wednesday, triggering a Buy signal for them.
The last glimmer of hope I will share is that it looks like that market behavior is shifting in favor of buyers. Our favorite measure of internal market structure is Lowry’s which has continuously tracked buying and selling pressure in markets for >70 years. They are the entity that originated the concept of a “90% up day” — where 90% of volume and 90% of points gained were up.
Since the sell-off started in February, the equity market has seen 6 90% down days, without a single 90% up day. And according to Lowry’s, a sustainable bottom cannot be established without evidence of “renewed demand.”
On Tuesday, the US markets posted its first “90% up day” signaling some evidence of renewed demand. But because short covering could be taking place, after such a bloody decline, this is not real demand.
Wednesday was an 83% up day. Meaning that it was another strong demand day. And as such, Lowry’s tends to view two “80%-plus” up days (or in this case, one 90%, and one 83%) as evidence of renewed buying.
They issued the following bulletin below. As noted, this triggered a “conventional Buy signal.”
BOTTOM LINE: The speed of the decline blind-sided our process. But we see more glimmer of hope. We realize many of our clients believe the S&P 500 could fall 50% peak to trough to 1,700, but this is not pre-destined. If the bulk of the decline behind us, investors need to pick winners and losers. And as such, we are moving through the nadir of the valley of bad news.


