Stocks fell 3% Monday and after an excruciating Sunday futures session (limit down), and some setbacks on the Senate front (bill stalled). Beyond the Fed QE infinity expansion, there were some marginally positive developments monday.
POINT: DEVELOPMENTS ON COVID-19 ARE BETTER, EVEN AS CASES EXPLODE IN USA
– Italy appears to be apexing on COVID-19 as both new cases and deaths are now lower two consecutive days. It means it took Italy 43 days from first case to peak case and 12 days after implementing the strictest travel restrictions. 43 days was exactly the same amount of time as it took South Korea to reach its apex. And if such is the case, the US would be 14 days behind Italy.

There is also progress on the treatment side. Trump has pushed the treatment regiment of Chloroquine (malaria drug) + Azythromycin, which is apparently used in France. And this is being used in the US and being sent to NYC by Tuesday. Someone shared a chart with me, that does suggest anti-malarial drugs might be onto something. Notice countries with malarial drugs are used have low prevalence of COVID. Weather could also be explaining this as well.

And we noticed something quite subtle in Trump’s
press conference today and last few days. Trump is walking back from the
full shutdown of economy (cure worse than disease) but we wonder if it White
House advisors are revising their views of disease severity and spread.
– Recall, their original “panic stop” was based on the influential
Imperial College Study which said 2-6mm Americans would die, exceeding deaths
from WWII and Spanish Flu.
– Since, then, many influential epidemiologists have almost ridiculed the
studies, saying it is based on laughably bad assumptions. And other
strategic isolation measures are better.
– Since then, mortality seems to be coming below the 3% presumed and for US, it
seems like 0.5% reported, and lower given prevalence of undetected
– Since then, the treatment regimen of anti-malarial + antibiotic could work,
or some other healthcare solution.
In other words, the US is rethinking how it wages a battle against Corona and
this could get the economy back on footing sooner.
POINT: MARKET RECOVERIES
ARE V-SHAPED, NOT L-SHAPED OR U-SHAPEDFinancial markets were certainly broken the last 6 weeks, obvious, given
the extraordinary measures taken by the Fed and other central banks and by
governments. And as such, investors think risk assets, particularly
stocks, are permanently broken–it feels that way sometimes.
But it might surprise investors that even the deepest declines, ala 1929 crash
and 1987 crash saw surprisingly symmetric recoveries–aka V-shaped.
We can measure this by looking at 3 points:
– months peak to trough (decline)
– months trough to 50% recovery (half of loss)
– months trought to re-attain prior highs (100%)
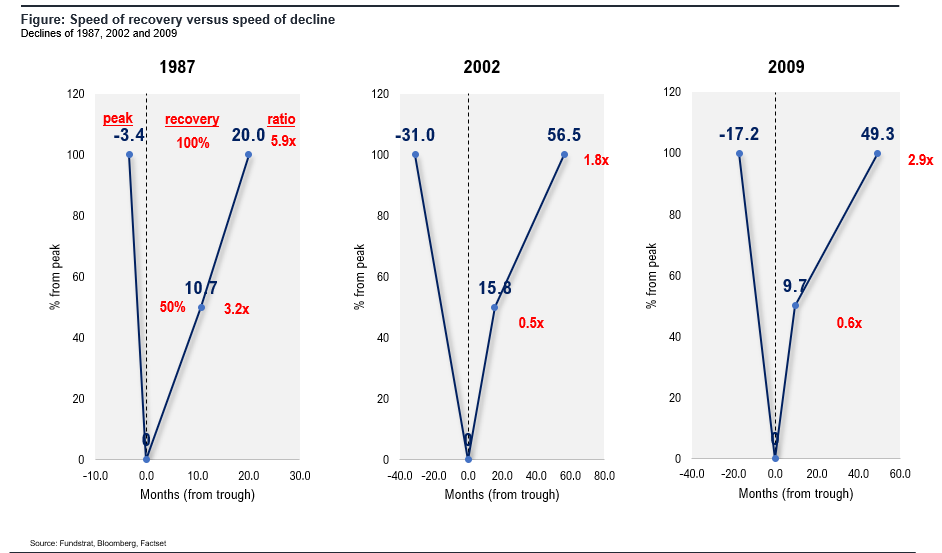
The 3 most recent drawdowns >35% are shown below. 1987, 2002 and
2008-2009. See the red markings?
– the time needed to recover 50% of losses is 0.5X the duration of the decline.
– in 2020, this means, a six week decline would require 3 weeks to recover 50%
back.
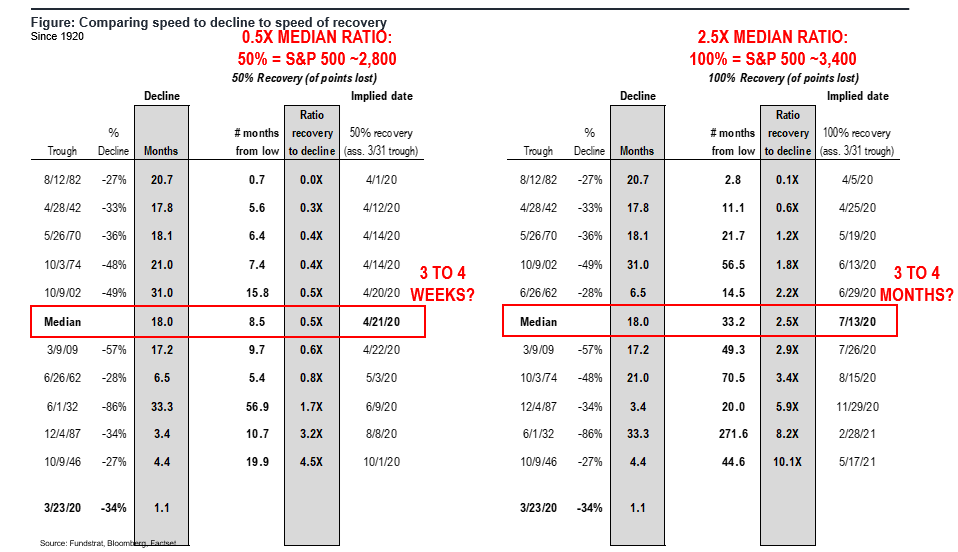
Thus, if a trough is happening this week, getting back to S&P 500 2,800 could
happen in April

We realize this sounds outlandish. Absolutely crazy.
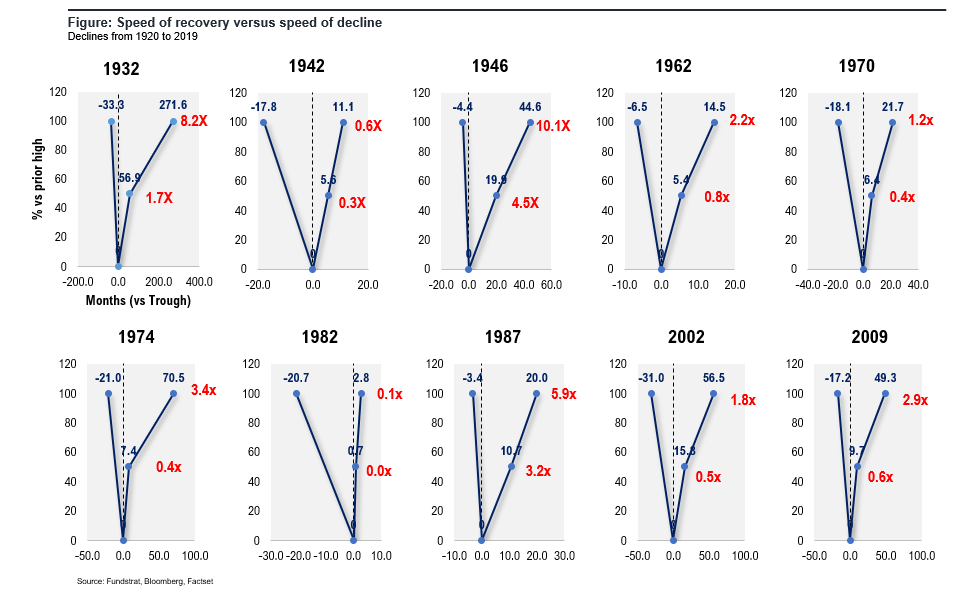
But look at the 10 drawdowns >30% since 1920 below.
– yepper, the median is 0.5X. Even after the 1929 crash required only a ratio of 1.7. Meaning, we could see 2,800 by June.
This is history.


You might think this cannot happen, because markets are broken. Perhaps. This is unprecedented times. Almost like biblical end times. But if this is like the 10 other times, we could see stocks in a seriously strong recovery by Summer. And perhaps even all-time highs by year-end.
Incidentally, this is not too far off from the developing view of Tom DeMark, the legendary and founder of DeMARK analytics. And one of the best known market timers. He thinks a possible major low is happening this week.
We are having a call with him on tuesday, March 24th. Check your inbox for details.
POINT: MARKET INTERNAL BOTTOM, BUY WHAT IS STRONGLastly, we have written about how the market seems to have established an internal bottom, similar to October 2008. And as such, stocks will begin to differentiate between winners and losers.
– what will be the losers? The hand is already revealed, because what has been weak is likely to be weakened.
Below, we highlight the sector performance of the major bears 1974, 2002 and 2008-2009. And highlighted in red the “epicenter” of the bear.
– in 2002, it was tech
– in 2008, financials (down 83%)
– in 2020, the epicenter is Industrials, Financials and parts of Discretionary. These are the weak groups and will ultimately be the biggest winners but this is where visibility is the weakest.
The better vector is Technology and Healthcare.

Bottom line, this market has been utterly dangerous since February. But there are glimmers of hope. And if such a recovery in risky assets is underway, it is likely to be V-shaped, not L-shaped or U-shaped.


