


After spending much of the week rangebound,
equity markets ended on a strong this week pushing the S&P 500 to a new
all-time high (3,120) and on track to exceed our recently raised target of
3,185 (+65). As markets push to ‘new highs,’ it is a natural inclination
to want to ‘fade’ this move. But we are in the final 8 weeks of the
calendar year and as such, different dynamics are at play:
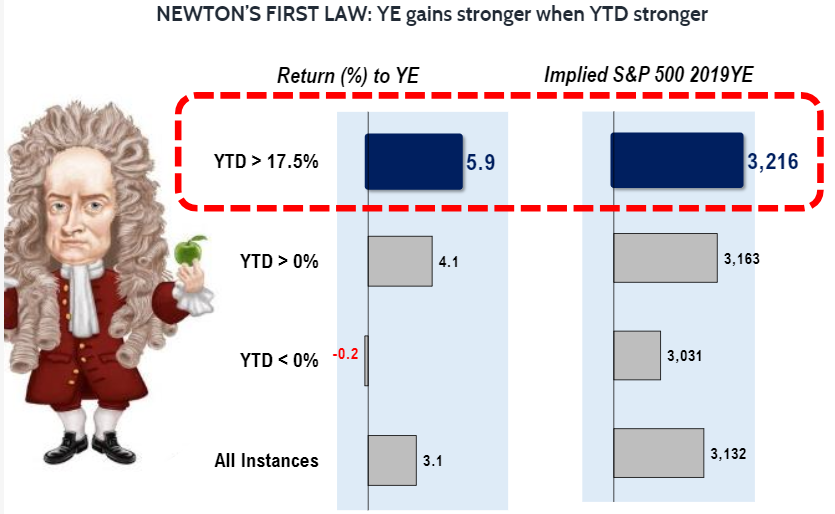
First…as we pointed out a few weeks ago, markets that show strength thru Nov 1
YTD, the rally into YE tends to be stronger. History says 3,216.
Another +100 points from here and very tradeable.
More importantly…The cadence of incoming economic data has improved. It seems that 3 regions are set to show renewed cyclical strength in 2020–> US, China and Japan. The rationale from Goldman Sachs and JPMorgan economists are listed below.
– US sees continued strong consumer + housing = capex strength in 2020
– Japan set to see PM Abe push fiscal stimulus 2020 (=better GDP)
– China is bottoming
The above 3 economies are > 50% of global GDP and as we have said multiple times, the US and China are the only 2 real drivers of the global economy and both look stronger in 2020.
If industrial cycle is bottoming, 2020 S&P 500 EPS growth could be 18% or better…The US Exports PMI moved above 50 and this is also reinforcing the idea 2020 economy > 2019 economy. In fact, over the last 25 years, when the ISM export moves from a negative value to >50, this has marked inflection points in EPS growth. The average EPS growth is 18%.
BofA Merrill Survey fund manager survey shows record “flip” in growth outlook–MAJOR SIGNAL Notably, we have also seen fund manager growth outlook (for GDP) improve in the past month. The survey saw a record move from -37 to +6.
– Since 1994, there are only 3 precedent times the survey jumped from -35 (or worse) to a positive value (below).
– the 4 instances are ’98, ’02 and ’09. This “flip” has taken place right in front of a massive upleg in equities.
DONT FADE THIS MOVE… 2020 ECONOMY > 2019 ECONOMY = RISK-ON
There remain 7 weeks into YE and we believe institutional investor positioning remains “uncomfortably” defensive. Hence, if the cadence of incoming data continues to improve, coupled with US-China trade war progress, sideline cash will amplify the “Santa Claus” rally effect.
We continue to be buyers of stocks here. Here is a list of quality cyclicals we think rally into YE. We identified 25 Value stocks ideas from our proprietary quantamental model within the YTD winning sectors that we believe will continue outperforming between now and year end.
– The tickers are TPR, KSS, LEN, PHM, EXPE, LMT, CAT, CMI, EMR, ROK, IBM, INTC, MXIM, QCOM, QRVO, PLD, CBRE, CCI, IRM, SBAC, CTL, DISCK, T, ATVI and VIAB


