In a way, March 9, 2020 was another “Black Monday” as the ~8% decline ranks it as one the 10 greatest single-day declines in history (out of 22,500 trading days). Think about that, the sell-off we saw today is one that is seen rarely–but it may feel familiar. Three of the 10 largest % day took place during the 2008-2009 Great Financial Crisis.
The causes of the sell-off are relatively obvious–it was a double “gut” punch of Corona escalation + massive negative shock (oil -30%)–but did it warrant the massive movements across asset markets? In just less than 14 trading days, the US equity markets have now priced in the 100% probability of a recession (20% decline) and this is similarly seen in the VIX (both the spot >50 and the magnitude of the term structure inversion) and even plunge in interest rates.
The massive movements on Monday (and Friday) were less about “price discovery” or equilibrium, but rather, a massive repositioning and de-risking by investors, in front of what many worry is a crisis greater than the 2008-2009 GFC.
– The best evidence is the fact that 97% of the S&P 500 trading volume, not 90%, but 99%, was down. There are only around 10 days in the last 40 years where down volume actually rounded to 100% of trading, so Monday ranks as a “sell everything not nailed down” day. We have now seen 5 90% down days in the past two weeks, something seen once in the last 30 years, which is August 24, 2015. Stocks managed a pretty sizable rally over the next few months.
– And only 7% of GICS 4 industries are positive over the last 3 months, a rare level of oversold and stocks were higher 93% of the time over the next month (n=14).
Bottom line: All hope is not lost. Not only is the market oversold, but it looks like the US fiscal stimulus is on the way.
To be fair, as dramatic as the ~8% decline seen Monday felt, it neither felt like a turning point in the market hysteria and risk-off. But at the same time, we can point to many reliable signs of selling exhaustion. Of course, the best evidence that a bottom is in place, would be a day where we see strong upside gains, aka, 90% up day.
In the meantime, the cadence of incoming corona and oil data is not necessarily universally negative. Foremost, it looks like US fiscal stimulus is on the way, with some economists scheduled to speak to Congress about potential packages. One as much as $350 billion. To an extent, this could put a floor on downside risk.
You might question if Dems would pass such a bill. Our policy strategist, Tom Block, not only thinks this is possible but he sees odds as “pretty high but better idea tomorrow when the WH package is unveiled and how House Dems respond. I think they can do this by their Easter break.” For those skeptics, remember, anytime a member of Congress can drop money in that person’s respective district, that is good odds for re-election.
Secondly, we are getting more incoming data on mortality. Michael Cembalest, JPMorgan CIO, wrote a very interesting analysis of Corona (see Eye on Market, Pandemic Gap). And the bottom line is that the mortality rate is highly likely to fall. And as such, the dire downside scenarios scene by markets is overstated.
In fact, the VIX term structure curve (see below) suggests that expected volatility should fall after May, which could suggest that markets see the pandemic peaking in the next few weeks.
POINT 1: Only 7% of S&P 500 GICS 4 (of 128) Industries have positive gains in the past 3 months, seen only 14 times since 1990
The S&P 500 is so oversold that only 7% of the GICS 4 industries (10 basically of 128) have positive returns over the past 3 months. As shown below, this is pretty rare.
– Like the end of sell-off rare.
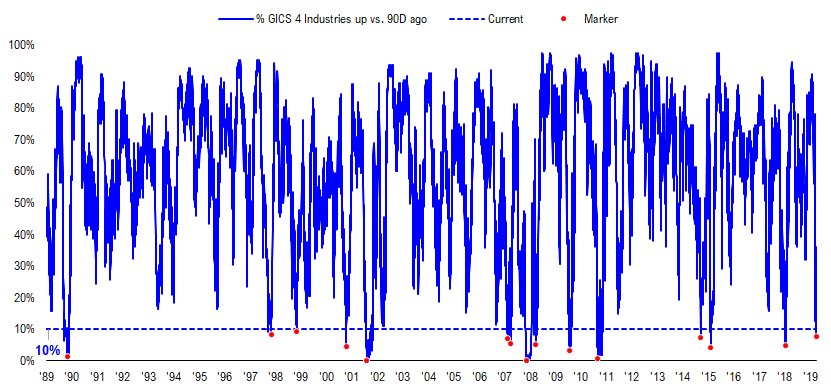
The table below lists the 14 times the S&P 500 saw the percentage of industries at this value or worse and the resulting 10D, 1M, 3M and 6M gains.
– Overall, this is a good tactical signal of some type of low. With stocks higher 79% of the time 10D and 93% of the time 1M later, with gains of 4% and 7%, respectively. In fact, the only times this was not useful was early int the GFC, where markets plunged and kept plunging.
– While many see early 2008 as the analog, other factors (below) highlight why if we are looking at any period in 2008, it should October.
POINT 2: WE HAVE SEEN 5 90% DOWN DAYS IN THE PAST TWO WEEKS, SEEN ONLY 1 OTHER TIME SINCE 1990
There have been 5 90% down days in the past 10 days, a shockingly high level of intense selling. In fact, since 1990, this has only happened one other time, August 24, 2015. While that proved not to the final low, it was the start of a tradeable rally in stocks.
– in fact, stocks did not bottom until Feb 2016, but again, this highlights that some type of internal bottom has been established.
We grouped the instances of 90% down days below since 1990.
– A single 1 90% down day (within the past 10D) is frequent (1,206 of ~10,000).
– But 5 within the past 10 days has only happened twice, and both happened in 2015.
As shown below, the forward returns are very strong with positive gains in every single period shown. Does it have to happen this time? Nope.
POINT 3: VIX INVERSION AND VIX SPOT POINT TO OCTOBER 2008, THE STRUCTURAL LOW OF S&P 500
Of course, any analysis of market structure needs to look at the market’s expected volatility, or VIX. We think the spot VIX matters but it also matters to look at the VIX futures term structure. Because when the structure is in deep backwardation (front months higher), this points to near term event risk. We plotted the VIX futures curve current (orange) and where it was a week ago and 5 weeks ago.
– Note how the front months are very elevating but start to flatten after May. In other words, at the moment, volatility markets are expecting elevated risk for the next 2-3 months, but then a more normalized risk environment after that.
This level of VIX inversion 1M-4M was last seen in October 2008. Which as discussed below, was the structural bottom for the market. In other words, if one took the extreme example that Corona risk is leading to a greater decline than 20%, the internal structure of markets points to a period akin to October 2008. That was a time when stock picking worked.
POINT 4:ECHOS OF STRUCTURAL BOTTOMING ALA GFC 2008-2009
For those who were actively managing money during the GFC, one might recall the S&P 500 had its “structural bottom” on October 9, 2008, 5 months before the “price” bottom. For a variety of reasons, on October 9, 2008, the equity markets began to discern between “winners” and “losers” and many stocks began to rise on an absolute basis. Even as the S&P 500 still had a 25% downside.
– the key lesson from 2008 is the Sector which did the worst in the initial 42%, were the ones which kept falling after the October 2008 structural low.
– in the example below, it was 3 sectors that led the downside –> Financials, Industrials and Discretionary. Thus, from October 2008 to March 2009, if you avoided those 3 groups, you generally had decent portfolio performance.
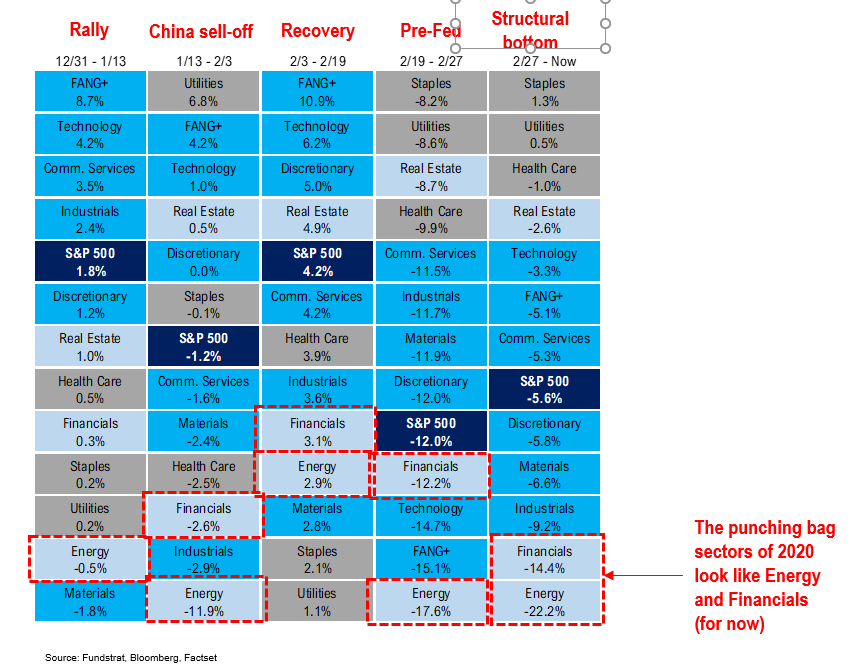
What is getting “gut punched” in 2020? Energy and Financials are the punching bags….
Since the start of the year, we saw essentially 5 phases of the market, mostly differentiating between China sell-off and the US sell-off.
– The two sectors which were consistently at the bottom of the performance ranking are Energy and Financials.
– The accelerating weakness is connected. Energy is hurt by the body slam in oil. And Financials have been hurt by credit risks associated with economic and now oil weakness. Plus the flattening of the yield curve and low rates, in general.
If 2008 is a template, for the next few months, both groups are tough. But Technology and Healthcare, leaders consistently, should be leaders over the next few months.