Last Monday (1/27), we shifted towards a short-term cautious positioning, on the heels of a dramatic widening in high-yield spread (+51bp by 1/27) and the inversion of the VIX term structure (1M > 4M), both of which have a very good track record of indicating de-risking by asset markets. Hence, over the course of last week, expected S&P 500 to correct towards its 50- to 100-day moving average (3,100-3,200, or 3,150 roughly).
– Falling to 3,150 would be a 2.5% further decline (from Friday’s close) and ~7% peak to trough decline.
– Instead, the first two days of this week saw S&P 500 rise 2.5% and the S&P 500 is now within 1.3% of its all-time high.
In other words, instead of the next -75 points being down, we saw a +75 point rally.
Price is no doubt signal. Particularly given the flood of negative news, the ability for equities to rally suggests that investor positioning was already considerably more de-risked than we perceived. And as our Global Portfolio Strategist, Brian Rauscher, notes — the NASDAQ hit an all-time high and “I don’t care how it got there”
3 THINGS THAT KEEP US IN THE CORRECTION CAMP (BUT NARROWING MARGIN)…
Hence, our conviction about a deeper correction has narrowed by a meaningful margin –> ala, let’s say we saw a >60% chance of 3,150, we are now still >50% chance of 3,150. There are a few reasons for this:
– High-yield OAS spreads (options-adjusted spreads) remain near wides 431bp STW vs 445 on 1/31 and +46bp wider than 385 on 1/17. Credit has rallied 1/3 the magnitude of the equity gains.
– VIX 4M is still below 1M (see below) and this type of backwardation (VIX sees near-term event risk) is not associated with risk-on.
– Lowry’s buying and selling data shows that while “selling pressure” was intense in the past 10 days (3 days saw 80% of volume to the downside). But the upside volume (as % total) for Monday and Tuesday was 65%. So not intense buying, despite the big points move.
Hence, while equities have staged ~75% recovery of the decline from 1/22 highs, the stubborn wides in HY and inverted VIX plus weak upside volumes give us pause. That being said, equity markets price move is SIGNAL. Hence, our conviction for a further decline is diminished. But our near term stance is that stocks are vulnerable to a 5% downside (towards 3,150). This does not change our full-year view and we see S&P 500 rising at least 10% but given the probabilities for higher P/E from falling equity risk premia, we see >15% total return.
POINT 1: NON-CONFIRMATION OF HIGH-YIELD OAS WHICH HOVER NEAR “WIDES”
The divergence between S&P 500 and HY spreads is shown below. We view credit generally leading stocks (not always) and hence, would expect HY to have recovered 75% of the widening since 1/17.
– To match S&P 500 move, HY OaS should be 400bp, or a further +31bp rally. It rallied on 14bp over the last 2 days. That is a long way away.
high-yield widened 6 days before equities peaked… foretelling of coming stock sell-off…
Notice how high-yield spreads started to widen on 1/16, which is about a week ahead of the S&P 500 top.

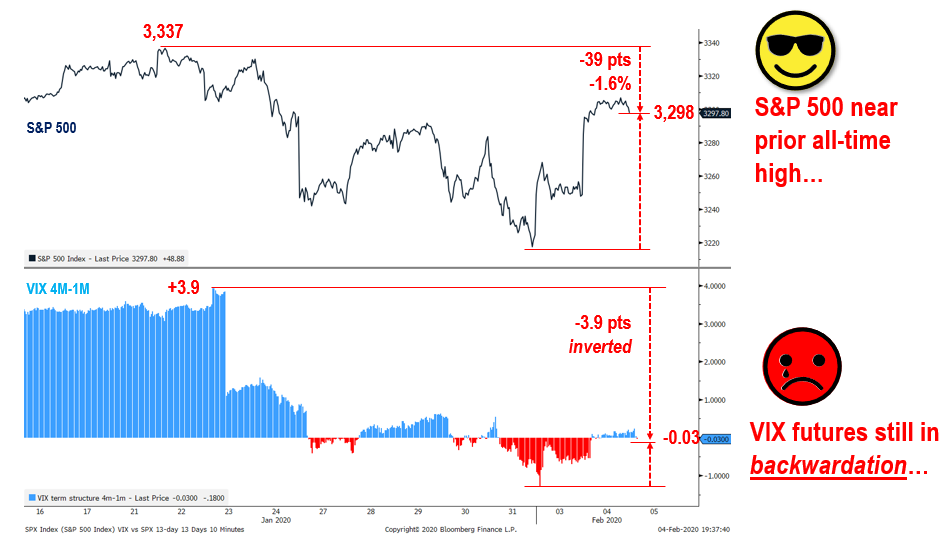
POINT 2: NON-CONFIRMATION BY VIX TERM STRUCTURE WHICH IS INVERTED (SEES EVENT RISK ST)
The VIX should be in contango in a normal risk-on market (VIX 4M > 1M) but as shown below, the VIX went from contango on 1/23 (+3.9) to now. It has remained stubbornly in backwardation.
– the last two days of rally did not change the term structure. VIX markets still see near-term event risk.
POINT 3: THEORIES ON WHY IS S&P 500 DIVERGING FROM CREDIT AND VOLATILITY MARKETS?
The natural question is whether there are explanations for why credit (HY OaS) and VIX do not have to recover, while equities might have already bottomed. And we can think of a few factors:
- Because of Chinese New Year and market holiday, macro funds shorted S&P 500 instead of Asian stocks, so S&P 500 needlessly fell.
- High-yield ‘over-rallied’ (view put forth by a macro fund today) and thus, the recent wides are a “mean reversion” so pre-1/16 wides are behind us.
- A major long-short hedge fund is imploding and their covering their shorts (including Tesla) is causing a massive temporary buy imbalance in stocks, hence, bonds don’t move.
- There is a plunge protection team.
- Equity risk premium is going through a secular collapse and hence, P/E rises faster than other risk markets (maybe)
POINT 4: TESLA IS THE ‘POSTER CHILD’ FOR EQUITY RISK PREMIA, AND ITS SOARING MEANS ERP MIGHT BE COLLAPSING…
Regarding the last point (of Point 3), perhaps the most important leading indicator of equity risk premia is Tesla (TLSA). We are positive on Telsa (it’s a long-time Granny shot, Millennial play, play on automation, etc).
Its 40% move in the past 2 days is a massive re-pricing of risk premia, in our view, as forward EPS estimates have not moved as much.
And a rise in valuation, by implication, is equity risk premia falling vs EPS. In other words, TSLA is the best proxy to watch ERP in equities. And its surge of 119% YTD is telling us overall equity market ERP is set to fall.
FOMO BY RUSSELL 1000 GROWTH MANAGERS = $14 BILLION OF BUYING VS $1 BILLION OF SHORT COVERING…
By the way, short covering is no doubt a factor in the move ($1 billion of covering) but as our earliest FLASH notes (see today), we think Russell 1000 Growth manager FOMO is a bigger factor.
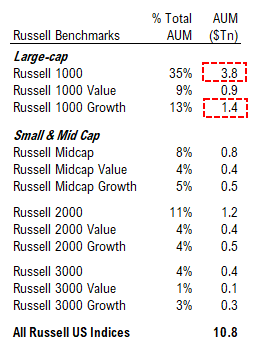
– We estimate that $1.4T and $3.8T of active AUM tracks the Russell 1000 Growth and Russell 1000 Index.
– TSLA is the 3rd biggest contributor to YTD gains in the Russell 1000 Growth Index (AMZN, MSFT, TSLA = 60% of R1K Growth gain).
– TSLA is only 0.7% of the benchmark but is 15% of the YTD gains (21X impact).
– R1K Growth managers largely ignored TSLA in 2019 (Elon conf calls, financing risk, deliveries, etc). Unless they miraculously went OW on 1/1/2020 (nope), the last 2 days could be FOMO.
– A 1% move in R1K AUM to TSLA is $14 billion of buying — 14X the amount of short-covering.