The January ISM manufacturing report was published this morning and it was an upside surprise.
– ISM Manufacturing 50.9 vs 48.5 (expected) and 47.2 Dec.
– ISM Exports 53.3 vs 47.3 Dec and best reading since September 2018.
The survey was conducted throughout January (when Coronavirus was building negative momentum) and the figure >50 is impressive. Since ISM does not disclose the timing of its survey (we asked them) but they do accept submissions even in the final week, it is not entirely clear if the full “fear of corona pandemic” is reflected.
Still, there is a lot of signal coming from this survey. Foremost, this generally affirms our view that the ‘risk-off’ associated with Boeing and with Coronavirus is transmitting its effect primarily through rising equity risk premia (P/E compression) rather than EPS risk itself.
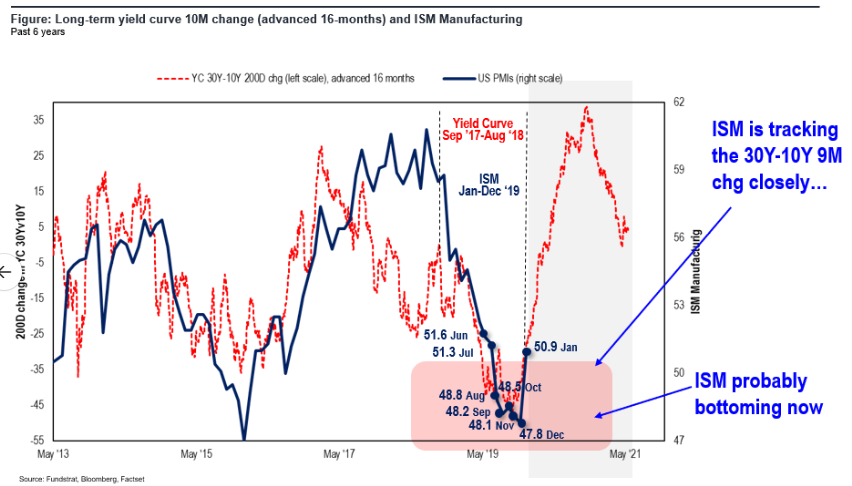
POINT 1: UNBLEMISHED TRACK RECORD OF LONG-TERM YC (30Y-10Y) LEADS ISM BY 18 MONTHS…
As clients of Fundstrat know, we view the 30Y-10Y yield curve as the ‘Jedi’ of curves and it has led the ISM Manufacturing survey by 18 months consistently in the last 3 business cycles (see our 2017 report on this, upon request).
– Last year, using the 30Y-10Y curve, we noted the ISM manufacturing should recover >50 by Fall/early 2020 and as shown below, this turn was indeed ‘textbook’ per the 30Y-10Y curve.
– The more important takeaway is the 30Y-10Y curve is pointing to a sharp recovery in ISM in 2020 with the ISM manufacturing likely approaching 60 by late 2020.
Hence, we advise against becoming macro bearish, although, in the near-term, we expect equity risk premia to rise.
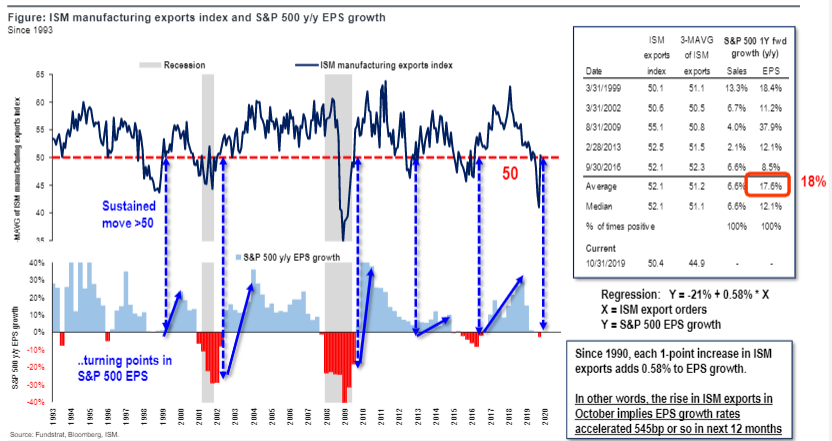
POINT 2: ISM EXPORTS 53.3 AND HIGHEST SINCE SEPT 2018 POINT TO S&P 500 EPS ACCELERATION…
The second key observation from the January ISM report is the strong Exports reading of 53.3 which is the highest since September 2018. The recovery in the ISM exports figure shows the easing of trade tensions is leading to an improvement in business activity–as expected.
– Historically, a move back >50 in ISM exports is associated with a pick-up in S&P 500 EPS growth. This has averaged 18% in the past 5 instances since 1999.
– In other words, the EPS recession of 2019 is likely ending in 2020, but more importantly, the Street consensus forecast of EPS growth ~10% may be too low.
BOTTOM LINE: THE JANUARY ISM AFFIRMS ECONOMIC FUNDAMENTALS IMPROVING BUT CORONAVIRUS RISK IS ON P/E
We remain bullish on the full year and expect the S&P 500 to see total return >15% (10% from EPS and 5% from fall in equity risk premia). But in the near term, we remain concerned about the widening of high-yield spreads (bonds lead stocks) and the inversion of the VIX term structure (4M is lower than 1M, which is abnormal).
– As we wrote last week, we don’t think stocks have deep downside but we believe S&P 500 will bottom between 3,100-3,150-ish which is around the 100D moving average.
– Lowry’s buying and selling also show that the type of intense selling (90% down day) has not yet taken place, so markets could have downside in weeks ahead.
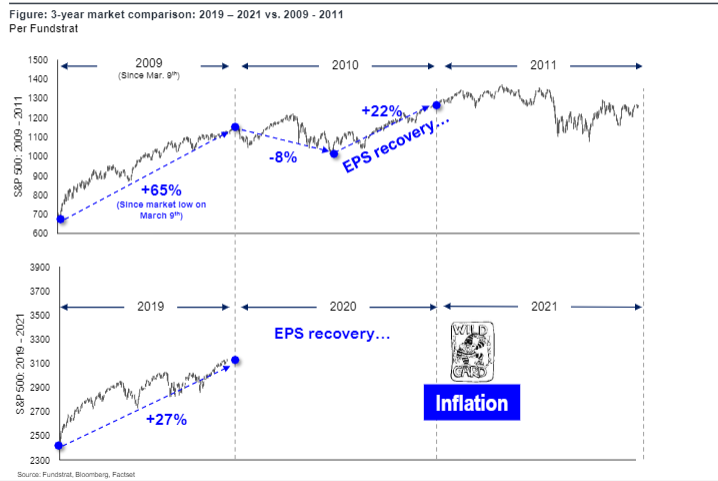
And this near-term view mirrors that 2020 would look a lot like 2010. Equity markets are stronger in 2H than 1H. See below.