-
Research
Macro Research
Actionable, timely investment insight and strategy
Crypto Research
Dynamic and industry leading research on digital assets
⚡️ FlashInsights
NewReal-time market commentary about macro and crypto events from our research heads
FSI Academy
Our research team provides educational guides for investors of all skill levels
Free Community
NewTom Lee's complimentary community for investors
Webinars
Join our exclusive webinars covering markets and how to achieve outperformance
-
Stocks & Crypto Lists
Newton's Upticks
NewMark Newton’s technically derived selections from the S&P 500.
FSI Sector Allocation
Our proprietary S&P 500 sector allocation strategy.
Crypto Core Strategy
NewAn allocation strategy in stablecoins, altcoins, and bitcoin seeking to outperform BTC.
Quantitative Strategy
Pleaceholder text //TODO
-
Webinars
-
Company
Contact Us
Send your questions to the FSI Team about our recommendations and research
About Us
Discover what makes us unique, and learn more about our history and core values.
Our Team
Check out the FS Insight team and their past achievements.
Our Services
See all the services we offer to our retail clients.
Onboarding
NewLearn how to make our research work for you.
Refer Friends and Family
Get rewarded for sharing the benefits of FS Insight with the people around you.
Gift Cards
Give a fellow investor the perfect present that they'll open every day of the year.
In the News
Find the latest media mentions of FS Insight and its team in the news.
Testimonials
Our best advertisement is simply the testimonials of happy members, which we receive on a daily basis.
Account Settings
Change your email address, password, notification settings and your membership status.
Merch Store
Visit our official store and shop for exclusive FS Insight and Fundstrat items.
Contact Us
Here's how you can get a hold of the FS Insight team.
-
Contact Us

- Latest Research
- Latest Videos
- Tom Lee, CFA AC
- All Research
- First Word
- Intraday Word
- Macro Minute Video
- Outlooks
- Mark L. Newton, CMT AC
- All Research
- Daily Technical Strategy
- Live Technical Stock Analysis
- Outlooks
- L . Thomas Block
- US Policy
- Market Intelligence
- Your Weekly Roadmap
- First to Market
- Signal From Noise
- Earnings Daily
- Fed Watch
- Markets Wrapped
- Crypto Research
- Strategy
- Comments
- Deep Research
- Archive
- Funding Fridays
- Liquid Ventures
- Latest Stock Lists
- Upticks
- Intro
- Stock List
- Performance
- Commentary
- Historical
- FAQ
- Sector Allocation
- Intro
- Current Outlook
- Prior Outlooks
- Performance
- Sector
- Tools
- FAQ
- Fundstrat Large-Cap Core List
- Intro
- Stock List
- Commentary
- FAQ
- Fundstrat SMID-Cap Core List
- Intro
- Stock List
- Commentary
- FAQ
- Latest Crypto Picks
- Crypto Core Strategy
- Intro
- Strategy
- Performance
- Reports
- Historical Changes
- Tools
- Crypto Equities Portfolio
- Strategy
Bitcoin Misery Index BMI
Sentiment indicator for the crypto markets
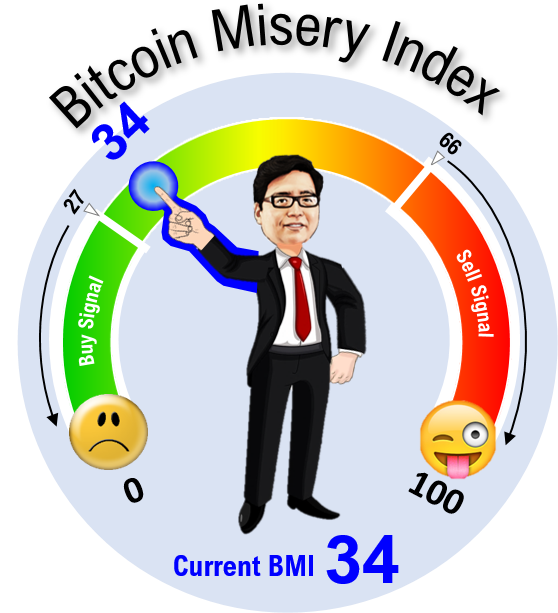
The Fundstrat Bitcoin Misery Index (BMI) ranges from 0-100 and indicates buy and sell opportunities for Bitcoin investors.
When the BMI falls below 27 it indicates a strong Buy signal.
The higher this index is the more likely Bitcoin's price will fall.
The Fundstrat Bitcoin Misery Index (BMI), a proxy for how investors feel about bitcoin’s “price action”, measures the expected sentiment of a holder of bitcoin (50=Neutral, <27 Misery,>67 Happy).
The two components of the BMI are win-ratio (% days bitcoin is up, higher is better) and the upside less downside volatility (higher is better).
The Misery Index ranges from 0-100 and is based on the following formula (7*(z-score win-ratio + z-score upside less downside volatility)+50).
The BMI is updated daily at 6:30PM EST