


Last week, the S&P 500 closed above the 5,600 level for the first time, reaching that psychologically important level even before June CPI numbers came in on Thursday. Headline inflation was negative for the first time since 2020. Core CPI rose just +0.06% MoM and 3.3% YoY, both showing inflation cooling from May’s data and both coming in below consensus expectations (0.2% and 3.4%, respectively).
Fundstrat Head of Research Tom Lee had much to say about that, but perhaps his reflexive response was the most telling: “Whoa.” The services ex-shelter component of CPI slowed to 4.92% (from 5.01% last month). “Inflationistas have argued that wages will keep services inflation high,” Lee said, “but this number contradicts that,” adding that “wage growth is already visibly slowing, so I don’t see services driving a second wave of inflation.”
Federal Reserve Chair Jerome Powell also acknowledged the cooling labor market in testimony before the Senate Committee on Banking, Housing, and Urban Affairs and the House Financial Services Committee this week. “The latest data show that labor market conditions have now cooled considerably from where they were two years ago,” Powell told senators, asserting that the risk of elevated inflation had thus come into better balance with the risk that “reducing policy restraint too late or too little could unduly weaken economic activity and employment.”
Lee commented that “overall, this is positive for equities, in our view, as this mitigates recession risk. In our view, inflation has been falling like a rock and the stubborn shelter and auto insurance have propped up CPI. But unfortunately, a ‘data dependent’ Fed is also thus keeping interest rates unnecessarily high. So, the Fed Chair acknowledging two-sided risks is positive for stocks generally.”
Head of Technical Strategy Mark Newton views the soft CPI numbers as catalytic, noting that the US Dollar and yields both turned down sharply after the latest consumer inflation numbers were released. Rather than a momentary trough, Newton suggested that further “declines in both look likely in the weeks and months to come.” Such a weakening in the dollar would be “generally supportive of rallies in risk assets,” he reminded us, and the same is arguably true for yields, as the correlation between stocks and Treasuries is still “quite strong,” in his view.

Chart of the Week
As our Chart of the Week below shows, many investors appear to remain concerned or convinced that inflation will re-accelerate. Back in April, investors expected inflation to climb back to 4.9% in the next 12 months. That peak for forward inflation expectations signaled a bottom for stocks, and although one-year forward inflation expectations are currently at 3.9%, “to me, that is actually still pretty elevated,” Lee said. “It needs to get towards 3%, so there’s a lot of room for the inflation hawks to come down. That means potential upside for stocks, and that’s partly why we urge investors to stay on target.”
Recent ⚡ FlashInsights
[fsi-flash-insights]
FSI Video: Weekly Highlight

Key incoming data
7/8 11:00 AM ET: Jun NY Fed 1yr Inflation ExpTame7/9 6:00 AM ET: Jun Small Business Optimism SurveyTame7/9 9:00 AM ET: Jun F Manheim Used vehicle indexTame7/9 10:00 AM ET: Fed’s Powell Testifies to Senate BankingTame7/10 10:00 AM ET: Fed’s Powell Testifies to House Financial ServicesTame7/11 8:30 AM ET: Jun CPITame7/12 8:30 AM ET: Jun PPIMixed7/12 10:00 AM ET: Jul P U. Mich. Sentiment and Inflation ExpectationTame- 7/15 8:30 AM ET: Jul Empire Manufacturing Survey
- 7/15 12:00 PM ET: Fed’s Powell Interviewed by David Rubenstein
- 7/16 8:30 AM ET: Jun Retail Sales Data
- 7/16 10:00 AM ET: Jul NAHB Housing Market Index
- 7/17 9:00 AM ET: Jul M Manheim Used vehicle index
- 7/17 2:00 PM ET: Jul Fed Releases Beige Book
- 7/18 8:30 AM ET: Jul Philly Fed Business Outlook
- 7/18 4:00 PM ET: May Net TIC Flows
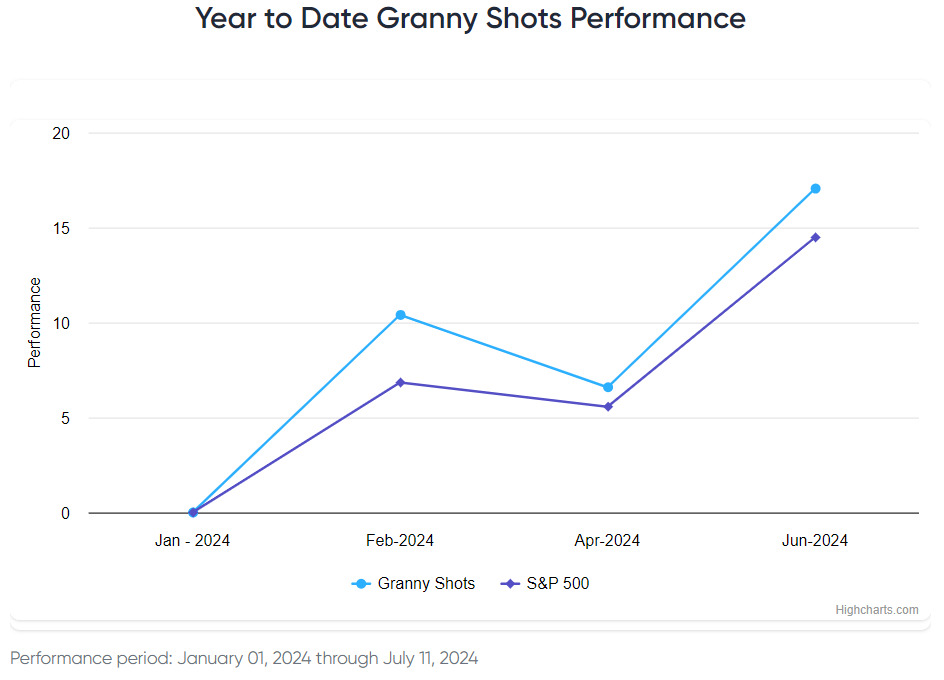
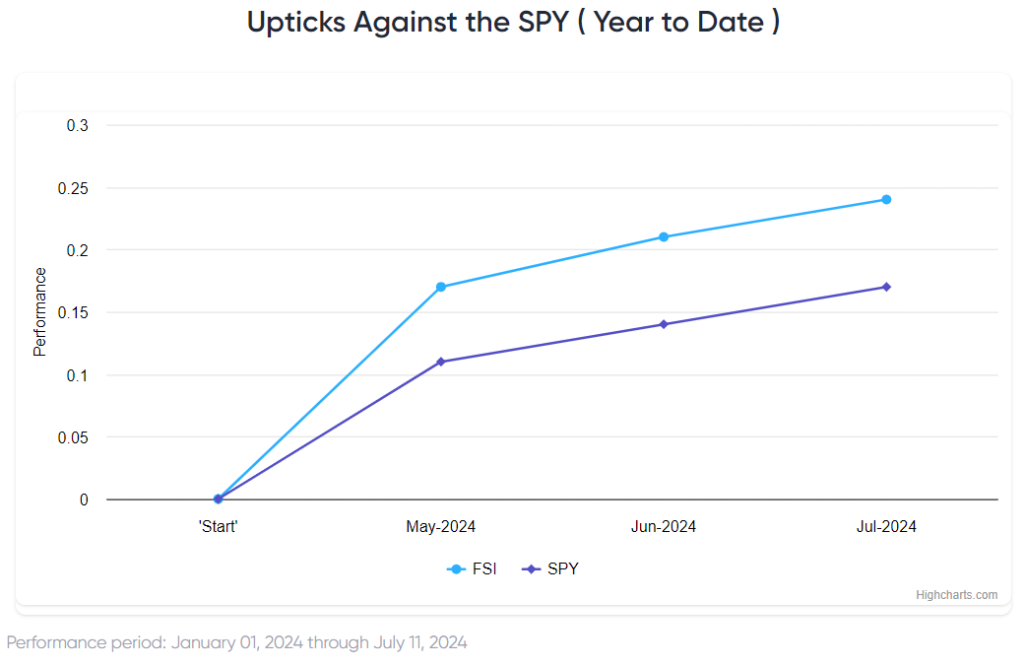
Stock List Performance
In the News
[fsi-in-the-news]


