
I continue to see the US stock market as being attractive, technically speaking, and do not feel sufficient risk is there to warrant a selloff at this time. While price action has been a bit choppy in the last couple weeks, there remain precious little other evidence with regards to frothy speculation to excessive valuation measures that would warrant a major selloff. Rallies up to SPX-5350-5400 look likely into mid-April before a consolidation gets underway. Treasury yields and US Dollar should have limited upside after this bounce, and both look close to rolling over.
The action in interest rates and US Dollar today might have proven to be more important than SPX’s close, technically speaking, but US Equities look yet again to have absorbed the minor attempt at a pullback and SPX has held its uptrend from early January.
FOMC Chair Powell’s “Data dependent” message along with his assurance that the next move for Rates is lower seemed to cause the entire Treasury yield curve to retreat to negative territory. Moreover, following the early week breakout attempt in Treasury yields, this latest reversal might be suggestive of a possible rally in Treasuries (pullback in yields), which might be jump-started following this Friday’s Jobs report.
Overall, US Equity indices seem to have held important support in the short term and Small and Mid-cap stocks showed some evidence of outperforming Large-caps in Wednesday’s session.
As the Ishares Core S&P Small-cap ETF (IJR -0.09% ) shows below, trends in Small-caps have been positive since last October. However, the relative performance vs. Large-caps has been notably sub-par since 2024 got underway.
What’s necessary to jump-start Small-cap outperformance? From an absolute basis, one can certainly say a move back to new monthly highs should help to technically act to supercharge this move in the IJR. However, until larger downtrends in IJR -0.09% vs RSP -0.31% are exceeded, it’s hard saying with any confidence that the Small cap outperformance has begun.
iShares Core S&P Small-Cap ETF
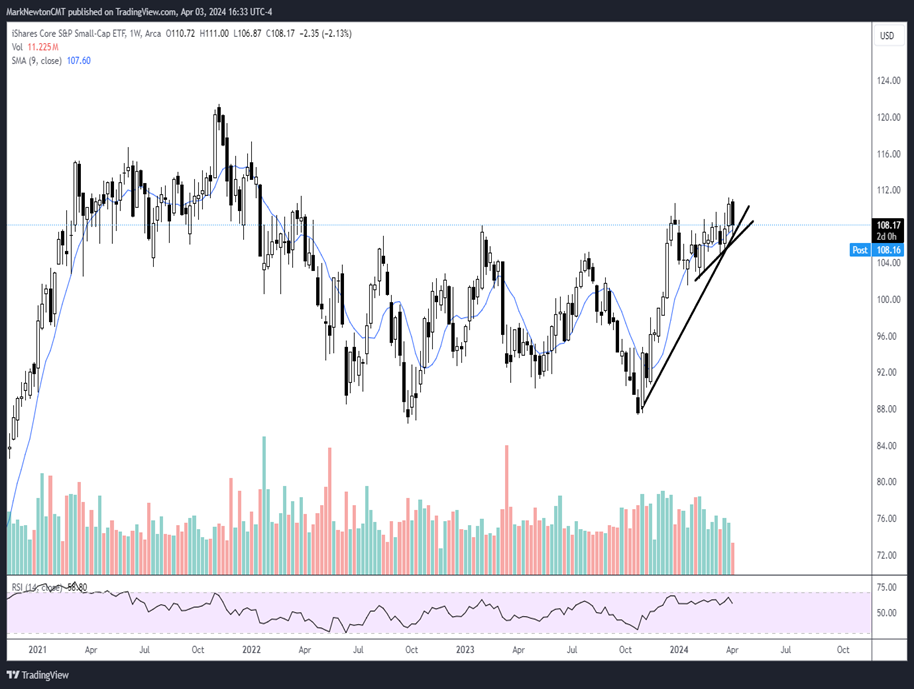
Overall, what should jumpstart the Small-cap rally? In my view, 4 things would be helpful:
- IJR exceeding last week’s highs $111.16 (Comparable level is $211.88 for IWM 0.25% )
- Friday’s (4/5) Jobs report coming in quite weak to match the declining Services data seen in Wednesday’s (4/3) ISM report
- See ^TNX break 4.18%. This could suggest a downtrend in Yields has begun
- Last, but most importantly, ratio charts of IJR/RSP and/or IWM/RSP require a breakout of the lengthy downtrend currently at hand since December 2023 initially and eventually exceed the lengthier flatter downtrend from late 2021
Overall, I agree with Tom Lee that Small-caps should be poised to start moving higher in a way that would make this Style attractive. However, technically a few things need to happen to be on-board from a timing perspective, and I’ve listed those above.
US Dollar index reversal near last month’s highs looks important
Technically I feel that this recent About-face in the US Dollar index (DXY) right near February highs was important earlier this week.
Furthermore, any weak Jobs report released this coming Friday likely could put further pressure on DXY which could be beginning a period of sub-par performance which would line up with current seasonality trends following a larger than normal 1st Quarter return.
Overall, I’ll be watching for evidence that Friday’s Jobs report might confirm some of the weaker ISM data released today. Technically speaking, any weekly close in DXY under 103.50 would send a loud message that this bounce from March had run its course and should result in a test and break of December 2023 lows.
The first warning of the DXY peaking out looks to have occurred this week on the reversal near February peaks. The next meaningful confirmation would revolve around this uptrend being broken. I feel that any weak economic data in the days ahead that results in further pullback in Treasury yields and also US Dollar index might kick off the decline in both DXY and TNX that I’ve been expecting for 2024.
For trend following investors, breaking under 103.50 should prove important and negative for DXY. (This would signal the start of a likely large rally in EURUSD and GBPUSD as well as decline in USDJPY.)
US Dollar Index

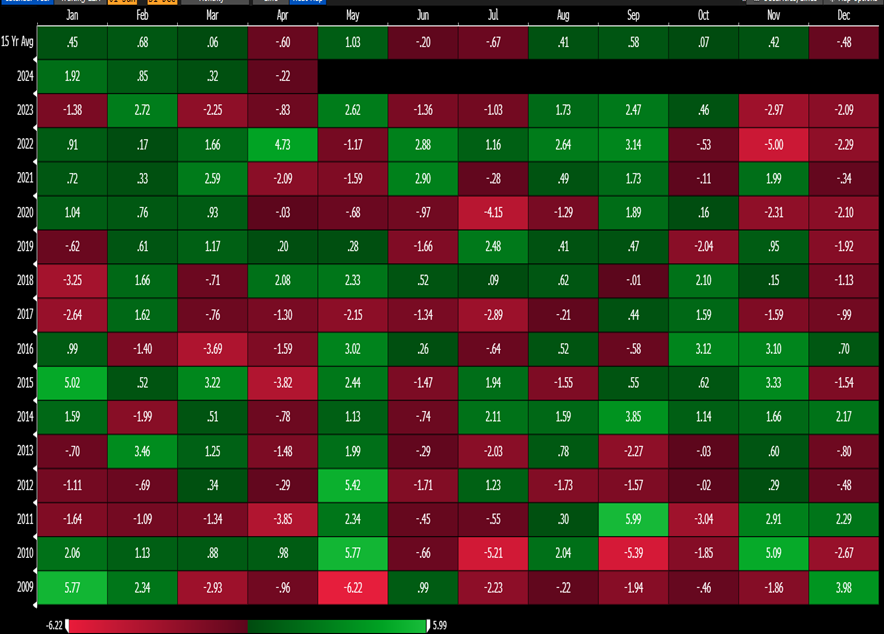
DXY Seasonality looks quite weak this month
Seasonality studies in the US Dollar index going back 15 years show the period from April through July to be particularly weak.
Average returns in April when viewing a 15-year average are -0.60% and April has been lower 11 out of the last 15 years. June and July also have negative average returns and June has been lower 10 out of the last 15 years.
Thus, at a time when the Dollar’s close relationship with Fed Rate bets has come unwound in recent weeks along with Powell’s messaging (Powell reiterated that the next move for interest rates should be lower) could combine to result in DXY turning down during its seasonally weak time.
Below is the Bloomberg seasonality grid which shows the average returns for DXY for each month going back 15 years and the 15 year average at the top horizontal row of this chart below.
The period from April through July has produced three out of four months of average negative returns for DXY over the last 15 years.
Bloomberg Seasonality Grid (DXY)
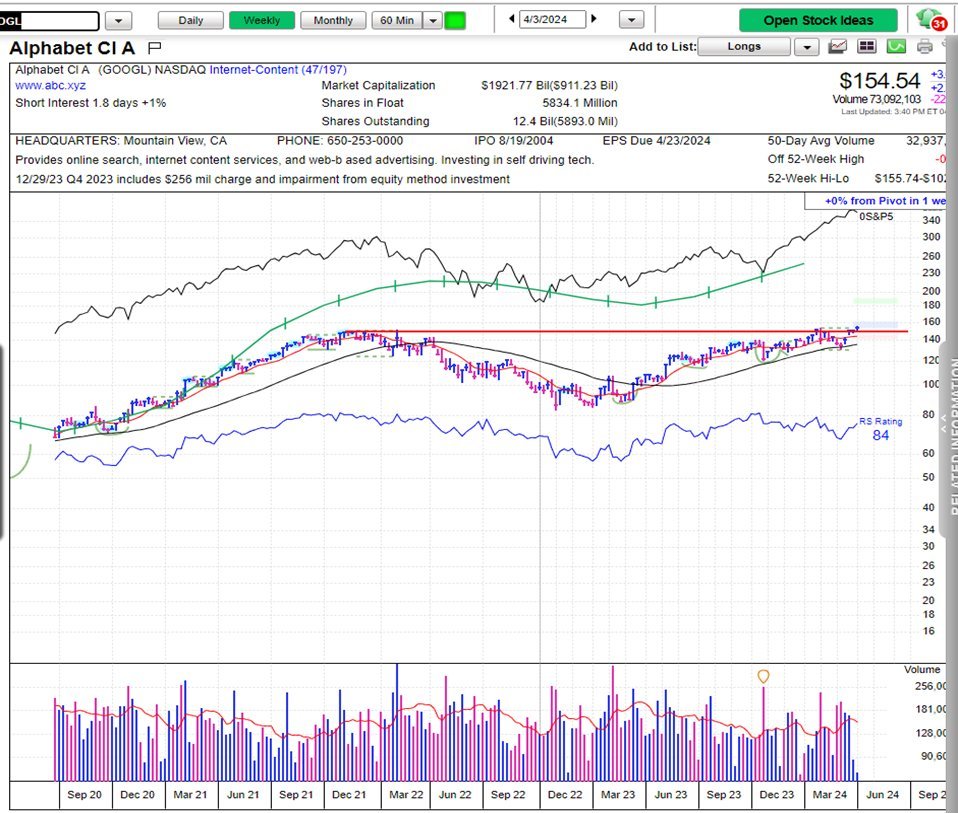
Alphabet Inc. Class A (GOOGL- $154.92) being added to UPTICKS list with Wednesday’s closing price of $154.92
The recent announcement of potential collaboration between GOOGL and AAPL resulted in GOOGL trading sharply higher on above-average volume.
As of April 1, GOOGL -0.87% broke back out to new all-time highs, surpassing peaks from both January 2024 and November 2021.
The ability to close out this week back above $152.19 (Holding current levels) would constitute a new all-time high weekly close for GOOGL.
This is quite constructive technically, and in my judgement should lead GOOGL to trade higher to resistance targets at $184, with support found at $143.50.
Overbought conditions have largely been alleviated with the consolidation over the last few months. Furthermore, this weekly close likely should result in GOOGL accelerating up to 184 as this pattern appears to show a successful upside breakout of a Cup and handle pattern from November 2021.
Bottom line, the underperformance in GOOGL of recent months likely has run its course. Furthermore, a period of mean reversion is now underway, and GOOGL likely should begin to exhibit leadership among the high growth names of Communication Services and Technology.
I feel this breakout is significant enough to warrant adding this stock to UPTICKS ahead of the release of the actual April report which likely will be unveiled over the next few weeks. (If sufficient change is needed)
Alphabet (GOOGL)