Equity trends show no evidence of wavering. Despite this week’s mild consolidation in Equity indices, the Cyclicals have managed to kick into gear to provide support to Equities and little evidence of any trend break has occurred in uptrends of QQQ or SPX. Technically speaking, this mild consolidation should represent a buying opportunity for a push higher into mid-March before any consolidation sets in. However, as charts below will show, it’s very possible that QQQ could lead markets higher out of this mild consolidation, despite this week’s underperformance. SPX requires a break of last week’s lows (SPX-4946) to have even minor concern about additional weakness.
To reiterate some of yesterday’s comments, with just one day left to February, SPX might log its best February since 2015, and the four-month period of November-February might log its first positive consecutive four months of gains since 2017.
Until/unless last week’s lows are challenged (4946-SPX) which I don’t think will happen right away, SPX very well can continue its rise into mid-March without much trouble, technically. While I’m on the lookout for evidence of DeMark based exhaustion and/or sector deterioration that might prove problematic, at present, we’re seeing the opposite, and the cyclical weakness possibility for mid-February has come and gone and now leading assets back higher, both Equities and also cryptocurrencies.
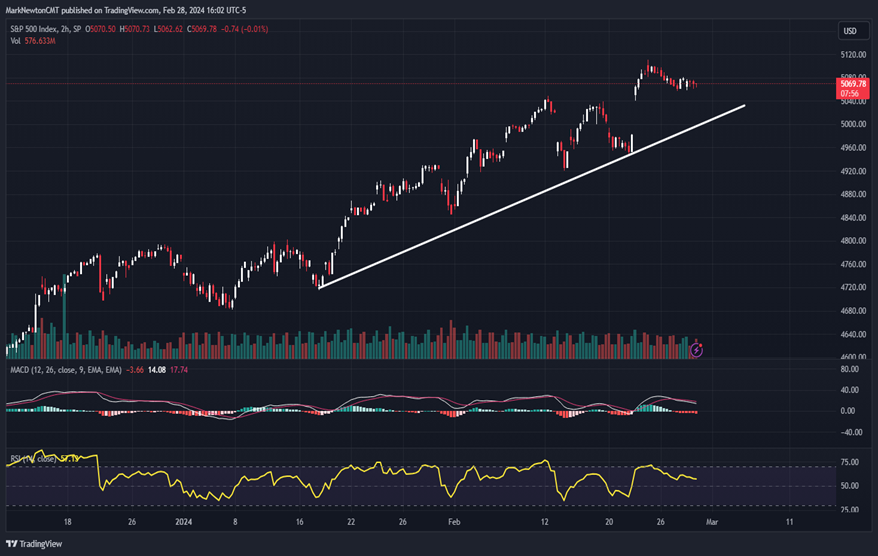
Below is a closeup of the daily chart of SPX which is intended to show some of the key areas that will represent importance for near-term trends. As this two-hour chart shows, following the gap back higher to new highs into late last week, the last few days have produced mild consolidation. This won’t really be a concern until/unless 4946 is broken, and technically I feel the opposite occurs into end of week.
SPX should begin a push back higher to exceed 5111 into the month of March. I’ll discuss upside targets in price and time next week, but another 2-3 weeks of gains look quite possible technically despite many market participants feeling SPX has grown elevated.
S&P 500 Index
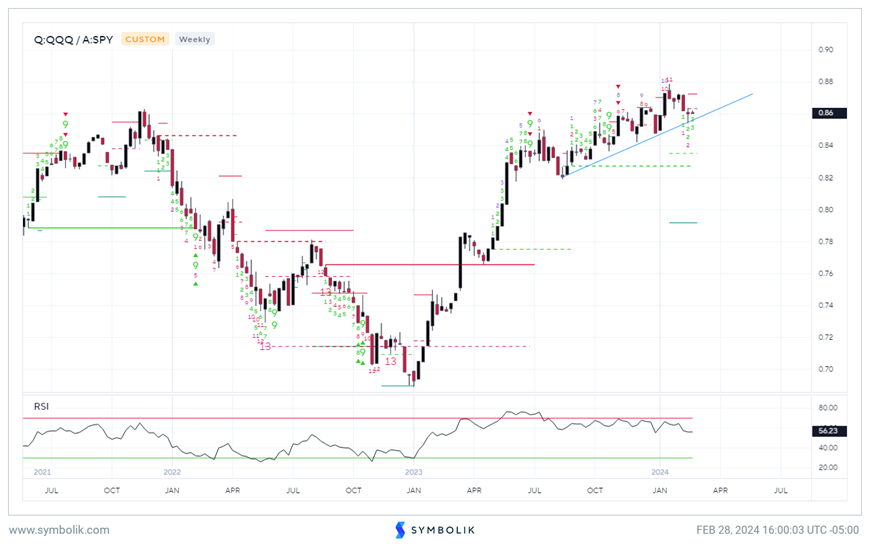
QQQ vs. SPY has shown minor consolidation only, but both short-term and longer-term trends remain very much intact.
As shown below, it remains difficult to be too negative on QQQ and/or expect that Technology is rolling over, despite some fractional weakness having been seen in recent weeks.
Daily ratio charts of QQQ 0.01% to SPY -0.10% show that following possibly five out of the last six weeks of minor losses in the ratio of QQQ to SPY, this now lies near a prominent level of uptrend line support drawn from lows from last Summer.
Thus, for those attempting to take profits in QQQ and/or expecting that some of the recent cyclical strength might begin to show even more outperformance in the days/weeks to come, we’ll need to see much greater evidence of technical deterioration than what’s occurred thus far.
Furthermore, DeMark-based counter-trend exhaustion did not signal any kind of upside TD Sequential “13 Countdown” sell at recent highs. Thus, the rally higher to test the peaks from late 2021 showed just some minor churning only in recent weeks, but arguably has not signaled any kind of peak in QQQ vs SPY, and the lack of a peak can also be seen in charts of Technology (not shown).
Overall, I suspect that another run back towards highs should occur in ratios of QQQ/SPY and that the minor underperformance in some of the high-flying Tech stocks that made this ratio turn mildly lower (as part of an existing uptrend) proves short-lived.
QQQ / SPY
Equal-weighted SPX set to drop for a second straight month vs SPX
While this week’s Cyclicals rally might give some investors comfort of a broad-based rally getting underway, and/or suggest that the Tech-heavy SPX might be starting to underperform, weekly and monthly ratio charts of RSP to SPY suggest the opposite, for the time being.
This ratio chart from Symbolik of Invesco’s Equal-weighted S&P 500 (RSP -0.31% ) vs. S&P 500 (SPY -0.10% ) in ratio form, has promptly given back some of the late year gains it showed back in 2023.
At that time, it looked possible that 2024 might show a huge period of mean reversion for Equal-weighted S&P 500. (In other words, a broad-based rally might materialize which would outperform the SPY, as Cyclicals began to outperform Technology.)
I still feel this is possible for 2024. However, the relative lack of follow-through to the prior rally attempt from December 2023 indicates a larger bounce in RSP -0.31% vs SPY might still need more time, and has not turned up sufficiently on weekly nor monthly charts (this latter not shown).
While the act of having stabilized near former 2020 lows does seem important potentially and some minor stabilization has gotten underway, there haven’t been sufficient signs of RSP continuing its late 2023 rally to trust that this has fully gotten underway.
January was negative for this ratio and with one day remaining in the month of February, RSP has lagged SPY for the month, and could be down two straight months.
Thus, any broad-based rally remains a work in progress, and this chart signals also what the prior chart had suggested regarding QQQ vs SPY still trending higher.
Bottom line, Wednesday’s outperformance in Industrials and Discretionary might be reasons for investors to have optimism about the broader market (as the Equal-weighted SPX was actually positive Wednesday.. i.e. markets were positive, despite SPX and QQQ having finished with fractional losses).
RSP/SPY

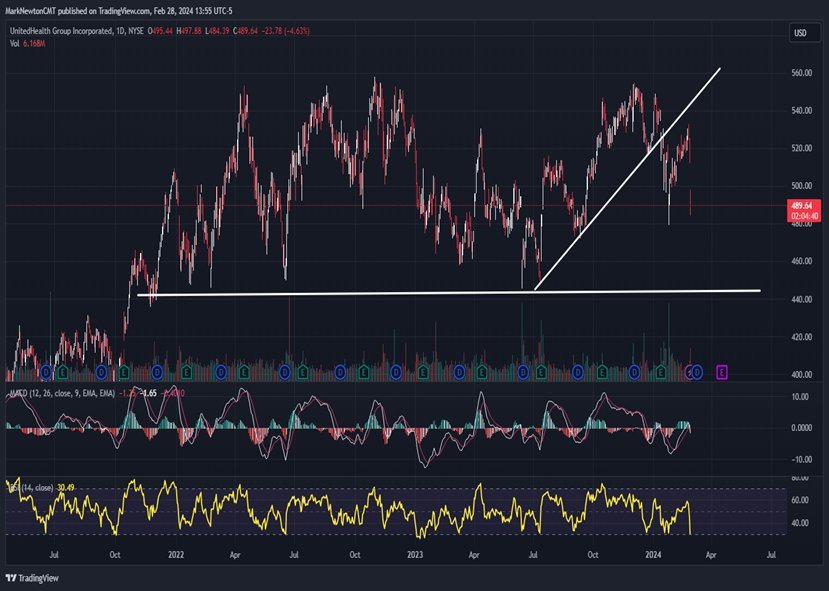
UNH decline takes a toll on Healthcare, and makes its trend more neutral than bullish in the short-run
Healthcare’s drop today was led by underperformance in RMD -3.03% , HUM 0.16% , VTRS -1.74% , and UNH -3.46% , the latter representing the 2nd largest weighting within XLV -0.47% at 8.75%, and Healthcare itself is the 2nd largest sector by market capitalization within the SPX at roughly 12.5%.
Thus, a -4.5% drop in UNH -3.46% is normally important and something to keep an eye on given its weighting within Healthcare as well as its influence on SPX. Today’s drop happened on above-average volume, which has led to a continuation lower following UNH’s peak last October within striking distance of former all-time high territory.
That area near $560 proved to be strong resistance, and it’s not wrong to say that UNH has slowly but surely been suffering some technical weakening in momentum over the last four months, as prices have been sliding lower.
The first warning sign happened in January following UNH -3.46% ’s break of uptrend line support near $525, and its rebound attempt failed to make any upside headway to rectify this negative development, bouncing to test the area of the uptrend line before rolling over this past week. At current levels, a test of $479 from late January looks probable, and this represents the first meaningful area of downside support. Any break of that level would have near-term bearish consequences, technically speaking and would be thought to potentially lead UNH down to test the more meaningful area of 2-year consolidation support near $445.
At present, the weakening in the stock in recent months has resulted in shares plunging back into this larger multi-year consolidation after a failed push to new high territory. While this larger two-year consolidation does remain within a larger long-term bullish uptrend, it has necessitated a more neutral view on the stock in the short run, and today’s downside volume on the selling makes buying dips likely something that will require patience.
Overall, additional sideways churning and/or minor downside selling pressure look more likely rather than an immediate snapback technically. To have a very bullish opinion on UNH technically it will be required that UNH recoup its selling and rise back above $540 which seems like a “tall order” in the weeks/months to come. However, that would be the technical sign that intermediate-term gains can happen. Until then, it’s wise to keep UNH at a smaller percentage holding as opposed to an overweight, until this can begin to stabilize and turn back higher Bottom line, the technical view is not bearish on UNH, but rather one that will require patience, as UNH has entered the so-called “Sleeper” state for the time being.
UNH Equity