
SPX and QQQ at new all-time high territory has not yet been followed by similar movement from Russell 3k, Value Line Average, and DJ Transportation Avg, and this divergence will be important to concentrate on in the weeks ahead. Technology remains an outperformer after its recent breakout. Meanwhile defensive sectors like Utilities, Staples are all starting to show evidence of hitting support, and likely are close to turning higher. Breadth has been waning in recent weeks while US Dollar and Treasury yields have begun to press higher which likely could bring about an upcoming consolidation for US Equities. At present, trends are bullish and trend reversals require a close back under 1/12/24 peaks to have even short-term concern. (SPX-4802.40)
The US rally showed some scant evidence of reversing course late day as Treasury yields began to turn higher. Yet, prices failed to make multi-day lows and merely closed down near the lows of Wednesday’s session. At a minimum, I believe SPX requires a close down under 4802.40 to have concern about a minor consolidation. Minor pullbacks into February should prove short-lived and should prove buyable.
Treasury yields and the US Dollar both need to be watched carefully as recent uptrends in both remain very much intact. Movement over 4.20% for TNX would likely coincide with consolidation in US Equities.
Utilities as seen by SPDR Select Sector ETF (XLU 1.38% ) has officially generated a TD Buy Setup while weekly TD Sequential indicators now have produced the first weekly “13 Countdown” since it peaked in mid-2022. This aligns with some of the positive technical signals which groups like Telecomm and Consumer Staples have begun to show lately ( I wrote about Staples in yesterday’s report) Bottom line, a bounce in defensive groups looks likely in February
US markets appear to be nearing a key timeframe for trend change. The timeframe in question at this point lies near 1/27-29. This aligns with a 3-month anniversary of the October 2023 lows along with a 6-month anniversary of last July’s (2023) peaks. I expect that by the end of this week, US Equities will have arrived at the next important window. However, any consolidation likely proves minor in scope and should bottom out into mid-February before a push back higher.
S&P 500 Index

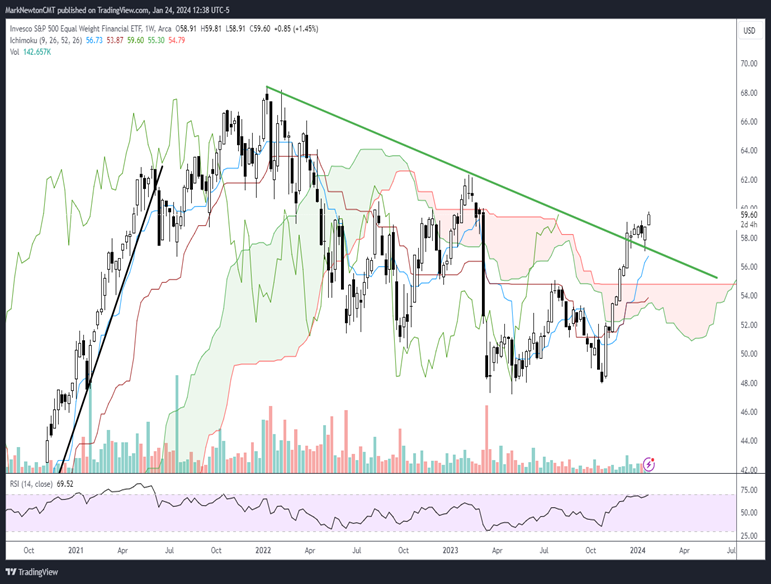
Financials turning higher is bullish for this sector, and can lead in short-term outperformance
Technology’s recent push back to new highs has been followed by strength in Financials, which in Equal-weighted terms, broke out to exceed an intermediate-term downtrend. (Invesco’s Equal-weighted Financials ETF (RYF 0.55% )
As shown below, this lengthy downtrend in Financials has been exceeded and should drive near-term performance in this group in the months to come. Relative downtrends in Financials have not yet been exceeded vs. the S&P 500, but the push back to new monthly highs should drive Financials to outperform for the next 4-6 weeks, in my view, technically.
Stocks like BRK/B, HIG 1.15% , AFL 0.34% , BRO 2.77% , V -0.28% , MA -0.34% , CBOE 1.58% , JPM 0.33% , ALL 2.16% , AXP 0.97% are some of the more attractive stocks within the Financials sector, technically speaking. While some mean reversion might be possible in some of the harder hit Regional banks like KEY 2.79% , LNC 0.76% , ZION 1.93% , RF 2.39% , sticking with the stocks within striking distance of 52-week highs is a more prudent strategy.
RSPF Equity
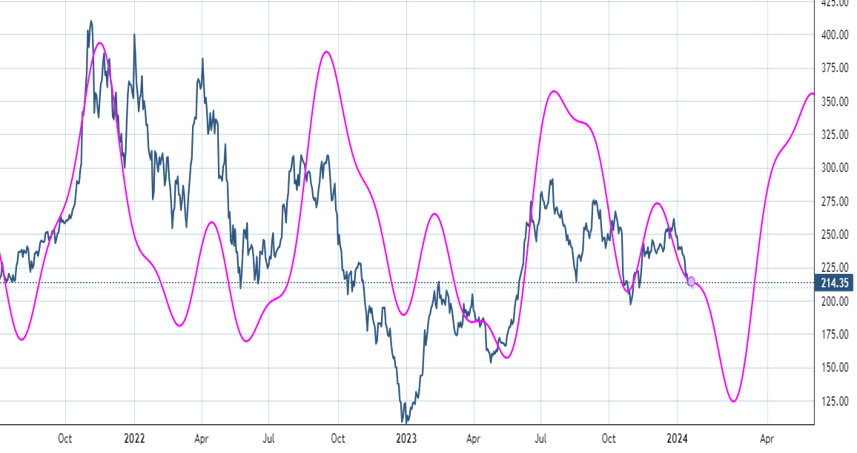
TSLA cycle composite remains lower until late February
Many investors might be questioning whether the recent consolidation in oversold territory might signal a buying opportunity for TSLA.
I analyzed this based on factors such as counter-trend exhaustion along with cyclically to determine whether this could be ready to turn higher.
My technical conclusion on whether TSLA is bottoming is that it’s still early given the following reasons
- Minor consolidation in oversold territory doesn’t necessarily constitute a buy signal, technically speaking. Strength will be needed to climb back above $231 to have confidence of any bounce; Meanwhile any decline under $206 is bearish
- Counter-trend exhaustion is early to materialize. Weekly charts illustrate that an additional 4-5 weeks for TD Buy Setups to potentially show up
- My cycle composite is negative for February, and this also could be the case for the broader US Equity market. (107 trading day cycles combined with 225 day cycle)
- While not technical in nature, TSLA missed on both earnings and revenues directly following Wednesday’s close (1/24/24). TSLA’s post earnings comments were that “2024 volume growth may be notably lower than 2023”(Via Bloomberg TV)
Regardless of where the stock opens for trading on 1/25/24, one needs to watch for any evidence of $206 being violated on a weekly close. This should result in weakness down to $194 and the potential for a symmetrical low based on the last two lows since last Summer.
Thus, $194 might very well be breached by a small amount, allowing for $180-$185 before this bottoms out. Time-wise this might materialize by late February, and weakness into this coming Spring should bring about technical signals which might indicate a more appropriate opportunity.
Tesla Equity
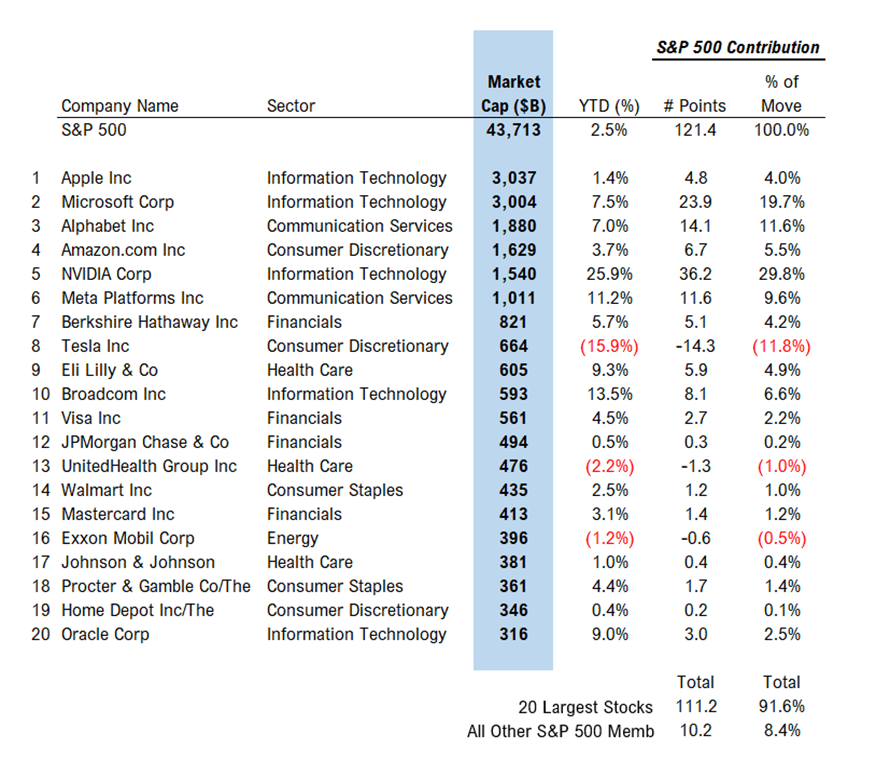
Constituent performance shows how dramatically NVDA and MSFT have led performance; Meanwhile TSLA is the big laggard
Examining the performance of the top 20 constituents within the SPX and how they’ve contributed to this year’s gains sheds some light as to the character of our recent rally.
Incredibly enough, NVDA and MSFT have represented nearly 50% of this move in January 2024.
Meanwhile, TSLA has been lower by -11.9% and remains an outsized laggard.
Given the cycle composite above for TSLA, investors attempting to “bottom fish” TSLA ahead of earnings expecting some immediate mean reversion might be disappointed, as its large negative spread compared to other top capitalization stocks might not snap back right away.
The influence of Technology this year has been unmistakable. Yet given Technology’s recent breakout back to new all-time highs relative to S&P 500 following a three-year basing pattern, it’s likely wrong to attempt to sell into Technology.
I expect any minor consolidation in Technology in February likely should prove short-lived and should represent an appealing risk/reward for many Tech stocks that have recently pushed to new all-time highs and might require consolidation.
S&P 500 Top 20 Constituents