


Near-term trends look to be turning down following a test of December 2023 peaks across multiple US indices on Thursday. Weakness over the next week looks possible, and could kick off a larger decline which extends into March. At present, 4682 from early January looks important, and could provide some support on weakness over the next 1-2 weeks. Meanwhile, both US Dollar and US Treasury yields could extend further to the upside in January. Both Healthcare and Financials look to be at resistance and this could prove to be a headwind for Equities over the next month. Bottom line, the risk/reward for new trading longs looks poor, while daily closes back under SPX 4739 gives more proof that a selloff is getting underway and should lead to an immediate test of 4682.
I feel Thursday’s CPI print was a short-term negative catalyst for US stocks and directly lines up with mid-January peaks shown in my Seasonality chart back on 1/4/23. My recent notes have discussed reasons for possible consolidation in 1st Quarter(1Q) 2023, and this directly lines up with minor breadth deterioration, bullish sentiment, bearish 1Q Seasonality, not to mention a negative trajectory shown by short-term cycles over the next couple months.
While I remain quite optimistic that pullbacks will bring about attractive opportunities to buy dips, I sense that our October-late December 2023 rally might require a 50%-61.8% retracement before a push back to new highs can occur. The risk/reward for new investments doesn’t look appealing at current levels for those with a 6-8 week timeframe.
As this two-hour SPX chart shows below, this might involve an initial test of SPX-4682-4700 area which looks important. While Thursday’s price action showed an intra-day reversal after the Bond auction near mid-day, it should prove difficult for SPX to surpass 4800 in the near-term, and 4900 looks very strong.
On the downside, I believe any breach of 4739, the intra-day low for SPX, should lead down to 4682 without much trouble. However, the violation of early January lows might not happen until February. At present, I expect a very choppy balance of January and my bias is for lower prices over the next couple months before another rally back to all-time highs can get underway.
S&P 500
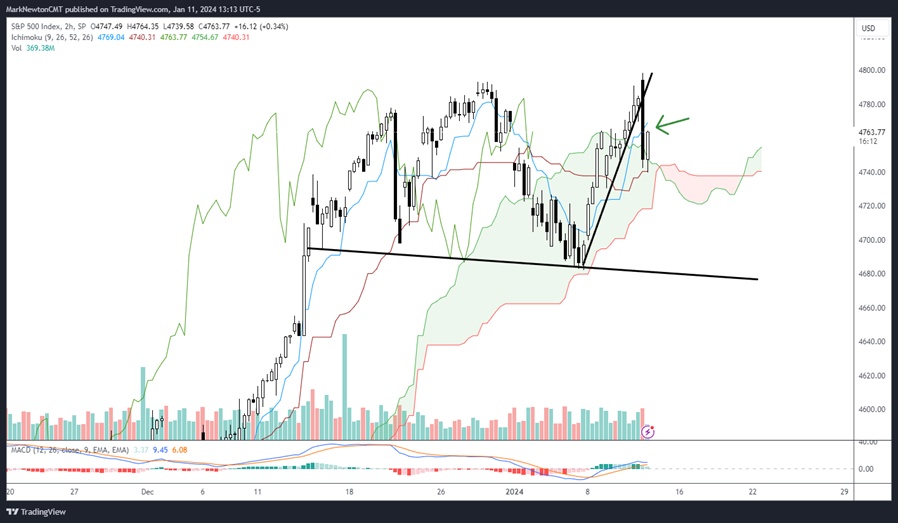
Finally breaks of early January lows at 4682 into next month would result in a larger decline which might approximate 6-8% into the Spring before the rally can begin to gain traction again.
SPX should have a difficult time eclipsing 4900 and might not exceed 4800 before turning lower. Price targets for March-April timeframe lie near 4450
This daily chart helps to put some of the recent churning into perspective. As can be seen, momentum has been dropping off lately which has coincided with an equal amount of waning in many market breadth gauges.
While I’m not certain that January’s price action brings about an imminent break of 4682, I do expect some volatile, choppy trading, which might initially result in a test of January lows, before a late-month bounce which would align with January’s intra-month seasonal trend since 1950 in Election years.
Furthermore, breaks of SPX 4682 mean that this decline into mid-February and potentially into March has likely begun.
I expect a 50-61.8% retracement of the prior runup from last October. Once this happens, I suspect that SPX will be a much better risk/reward and Technology, Industrials, and Healthcare, not to mention Consumer Discretionary and Financials should offer opportunity.
Energy might bottom out in February, and this sector looks appealing also for a 6-8 month trade. However, the short-term chart structure isn’t too compelling at the moment and more evidence of Energy bottoming out will be necessary. SPX’s daily chart with retracement levels, is shown below.
S&P 500

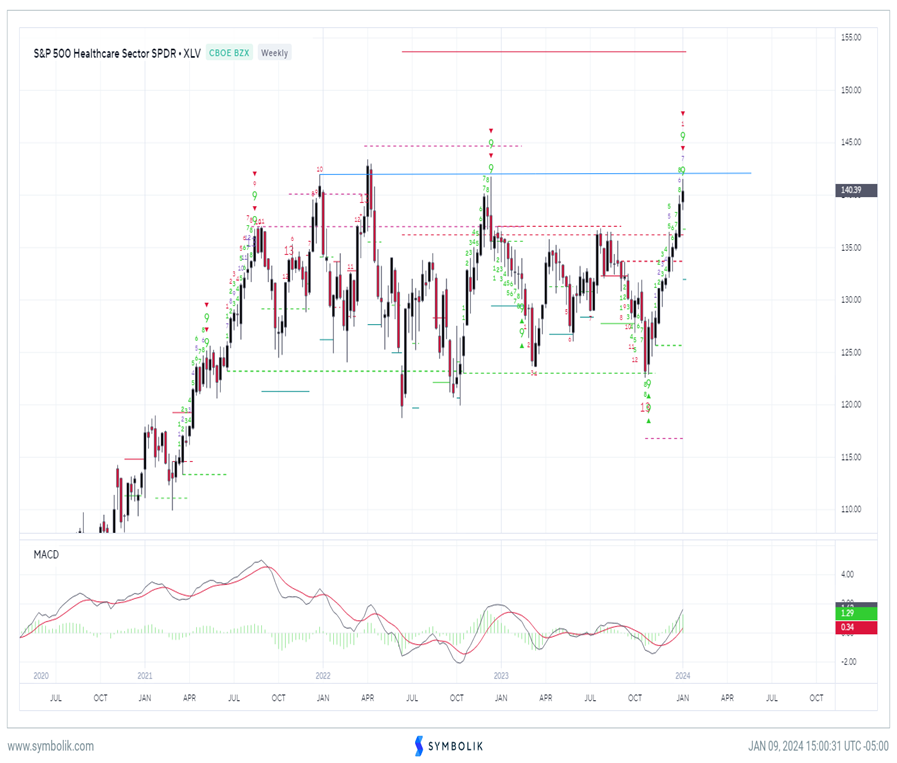
Healthcare has now reached short-term resistance
Despite the relative breakout in recent weeks of Healthcare vs. SPX that I discussed last week, the sector looks to have reached strong resistance on an absolute basis that likely prohibits this from making much further headway.
As can be seen, with XLV 0.42% having exceeded $140 this past week, XLV has reached levels that marked peaks in December 2022, and lie right near April 2022 peaks and December 2021 peaks.
Thus, several former highs occurred near this same level. Furthermore, counter-trend DeMark-based indicators have just produced a “TD Sell Setup” on weekly charts which was also present at the December 2022 high along with the August 2021 peaks.
Overall, I suspect that current levels might prove to be temporary resistance, as I do respect the breakout in the Healthcare sector in relative terms to the S&P 500. However, in the short run, meaning the next 1-2 months, I believe this might lead to consolidation.
As the 2nd largest S&P 500 sector by market capitalization, this could have an effect in providing a headwind towards S&P moving immediately above 4900.
Overall, on any pullback to $133-$136, I find XLV to be quite appealing technically and do expect an eventual push up to $155. Healthcare likely should outperform into July, and the Summer months tend to be quite bullish for the sector.
However, I believe one needs to be selective at this point in Healthcare until consolidation has occurred. For those involved in this sector, I find stocks like ISRG 1.22% , VRTX -0.65% , REGN 0.73% , BSX 1.20% , LLY 0.41% , NVO -5.10% and MRK 2.70% quite attractive. However, consolidation would create a more appealing risk/reward for Healthcare.
Healthcare Sector (XLV 0.42% )
US Dollar has broken out in the short run, along with Treasury yields over the past week
As shown below, the DXY, the ETF for the US Dollar index, has officially exceeded the downtrend from late last year.
Furthermore, the decline from last Fall looks to have played out as a five-wave Elliott-wave style decline. This has a couple of important implications, in my view:
- A counter-trend bounce should now be underway in the Dollar. I suspect this might push up to $103.50, and eventually to $104.50-$105 before turning back down to new lows into Summer/Fall 2024
- Emerging markets will likely underperform as the Dollar rises and also some commodities.
- The time-frame for a possible counter-trend bounce pinpoints mid-March for a possible turn, specifically 3/21/24. This would represent a 100% time retracement of the 85 day decline in DXY (10/3/23-12/27/23)
- Following this bounce, I expect DXY to pulback to new lows and should test and/or undercut last Summer’s lows at $99.57.
- The shape of the movement for most of 2023 was quite choppy and overlapping. This should indicate that Dollar weakness likely proves temporary this year before the Dollar starts to turn back higher. (this might make sense if US growth is superior to Europe)
Overall, I suspect that DXY could lift over the next 1-2 months. However, this would be a chance to expect meaningful resistance and should be followed by sharp weakness in USD/JPY along with strength in EURUSD and GBPUSD.
US Dollar