
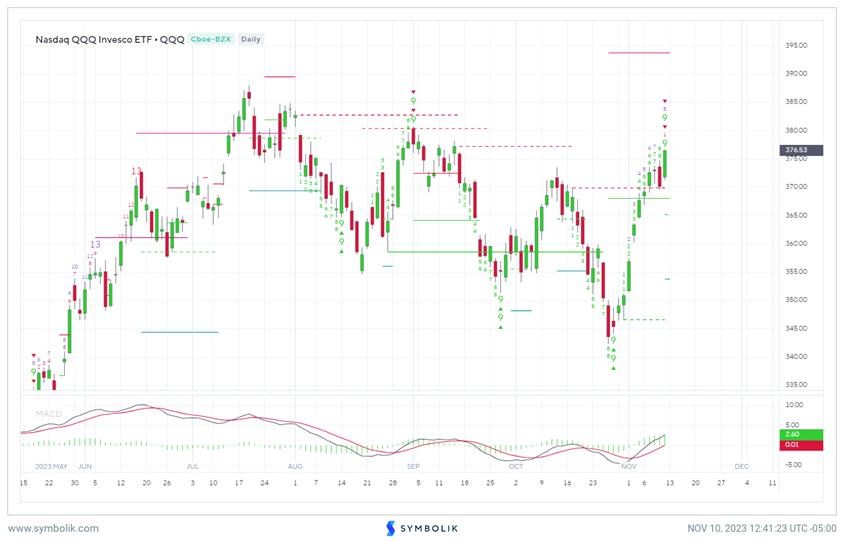
SPX and QQQ look to be peaking out following the last 9 of 10 days of rally, which has brought QQQ up to former peaks. As discussed previously, Technology has done a stellar job in overrepresenting the degree of market strength while most sectors have been slow to participate. Market breadth and weekly momentum remain negative and quite a few US indices have rallied up to key downtrend lines. Treasury yields have stabilized and have begun to push higher and this arguably could continue next week, which might adversely affect Equities. Overall, my work suggests that there stands an above-average chance that US Equities will consolidate recent gains and undergo consolidation into Thanksgiving holiday before rallies can continue.
Daily QQQ charts below have successfully formed TD Sell Setups as of today’s close (Friday 11/10/23). Friday’s rally occurred on negative momentum divergence in QQQ, as the last couple days of stalling out brought about a downturn from overbought levels which has not been reclaimed on hourly charts.
Overall, I am expecting a decline to 365 and potentially 360 in QQQ before any push to challenge July highs.
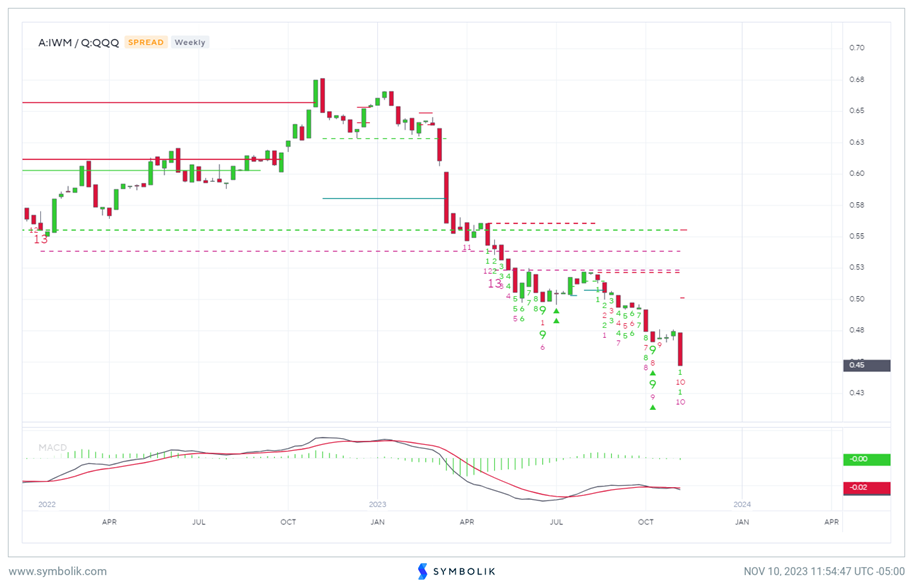
Small cap weakness vs. QQQ still premature by nearly a month and might take 3 months before this can work
Small-caps have underperformed dramatically this past week, and ratio charts of IWM 0.63% relative to QQQ -0.17% have broken down to the lowest levels of the year.
Similar to the ratio of SPY to FXI being early, this also looks early to favor any type of relative recovery in the Russell 2000 relative to QQQ.
I do expect an eventual snap-back and mean reversion which might favor some outperformance in Small-caps in 2024. However, this might not occur until late December heading into January.
For those investors skeptical of the current advance in US Equities, it’s the underperformance in Small-caps which technically looks most likely to underperform vs Large-caps into December and potentially into year-end.
Mean reversion rarely works as planned on fighting a push down to new lows for the year and DeMark-type exhaustion suggests Large-Caps should still be favored in the US, and it’s wrong to bet on any meaningful bounce in the Russell 2000 relative to Large caps.
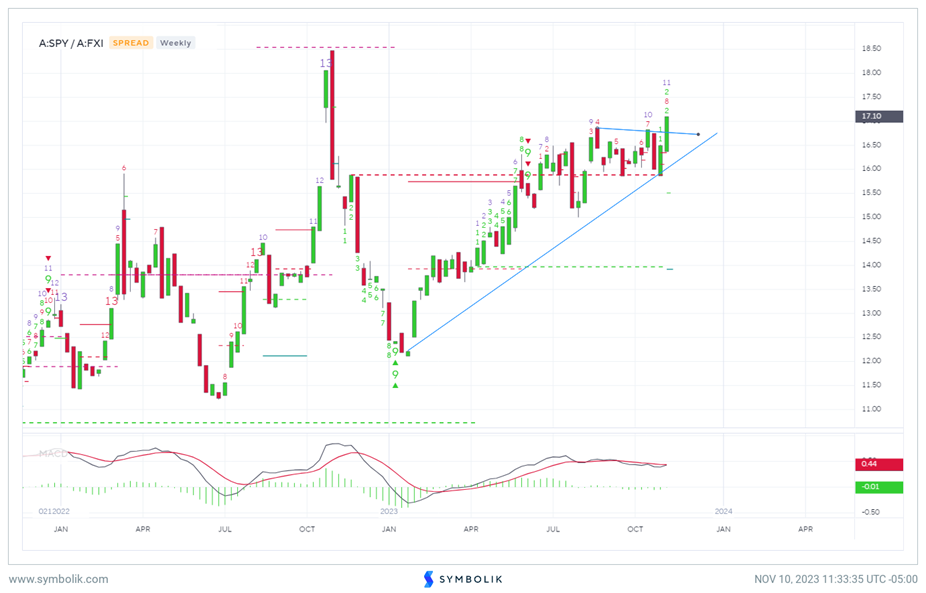
US should be favored over China in 4Q 2023
With the anticipation of the upcoming Xi/Biden meeting, many investors are wondering whether it’s finally time to favor Chinese Equities and expect some kind of mean reversion.
Technically speaking, this does not look to be the right time to buy dips in China just yet and ratio charts of SPY to FXI -0.45% (Ishares China Large-cap Equity ETF) have just broken out again to the highest levels since last Fall, 2022.
As this weekly chart shows of the relative pair below (SPY -0.13% vs FXY -0.28% ) the breakout this week is exceeding highs of the last 11 weeks. This should arguably allow for at least another 3-4 weeks of upside follow-through, relatively speaking, which favors US Equities over FXI.
While investors should watch the developments surrounding “Singles Day” (the largest one-day online shopping event in the world) it’s unlikely that this relative ratio between the two countries equity markets will reverse course without some evidence of exhaustion, in my view.
Given this week’s breakout, DeMark indicators suggest another 2-4 weeks of potential US outperformance. FXI likely could find some stabilization following weakness to $24.85, or $24.25, but given the numerous failed breakout attempts this year, investors will need to see proof of technical recovery.
This will involve waiting until FXI reclaims $26.64, which will help to surpass minor trendlines going back since early September, 2023.
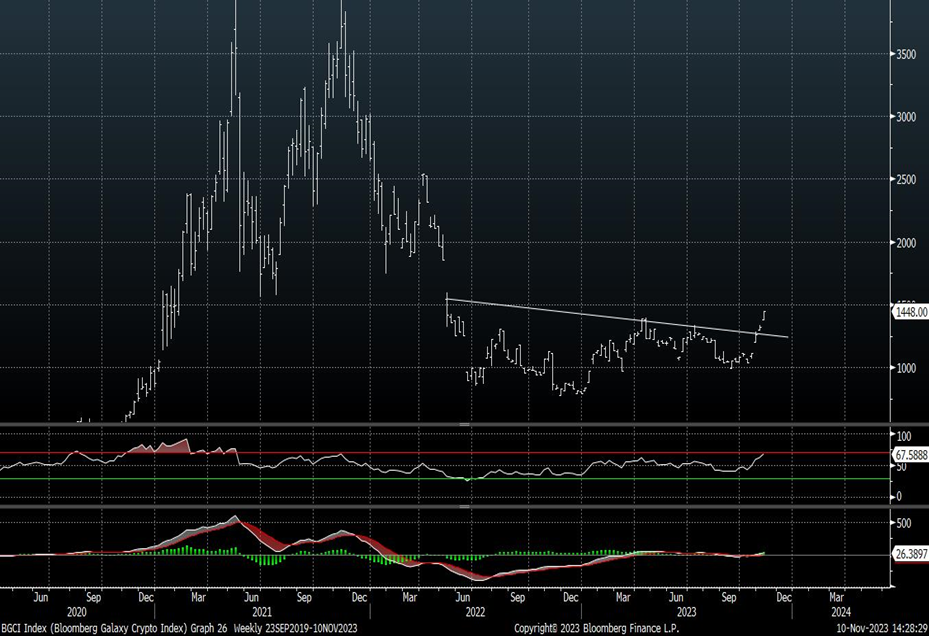
Bloomberg Galaxy Crypto Index has reached highest since Spring 2022
Given the anticipation over both Bitcoin and Ethereum spot ETF’s, both coins have broken out of very well-defined structures in the last week, and this is also quite apparent when eyeing Bloomberg Galaxy Crypto Index (BGCI) which is comprised of the top 25 coins by Market capitalization.
This week’s breakout is encouraging for the entire Cryptocurrency space as the index has risen from an oversold state to hit the highest levels since last Spring, 2022. Moreover, this pattern resembles a reverse Head and Shoulder pattern, and the act of surpassing two former meaningful highs constitutes an official technical breakout.
Thus, it’s not wrong to say the former sideways consolidation of the last year for Cryptocurrencies is now beginning to change into an uptrend following the “Crypto winter” from late 2021. Overall, while some coins have gotten near-term overbought, I sense the next 1-2 months can show further gains across the cryptocurrency spectrum ahead of a cyclical decline in 1Q 2024.
Daily Crypto Technical analysis is available through our Digital Assets team at Fundstrat/FSInsight, where I contribute daily analysis on different coins each weekday in their daily reports.