QQQ, DJIA and SPX are right at October lows, and should attempt to make a stand this week. However, this likely does depend on stellar Technology earnings along with a larger rolling over in both US Dollar and Treasury yields. A sharp, high breadth Equity rally is needed nearly right away to prevent selling pressure into late October. Given the degree of broader market weakness, the burden of proof is certainly on the Bulls.
At the time of this writing, following post-market close (Tuesday) earnings out of MSFT -2.72% , HPQ -0.70% , GOOGL -0.19% , haven’t helped to lift Equity futures in the post-market futures market. MSFT rose, along with DDOG -2.11% , and SNOW 0.68% , while both HPQ, ADI 0.08% , and GOOGL fell. (5pm EST) Thus far, earnings look like a mixed bag for Tech ahead of their respective conference calls.
Given that broader Equal-weighted gauges for US Equities have slipped to the lowest levels of the year, markets are truly much weaker than what might be expected when just eyeing QQQ or SPX on their own. A strong lift out of Technology is thought to be important towards seeing the market bottom out, along with evidence of stabilization out of both the Bank stocks and Healthcare.
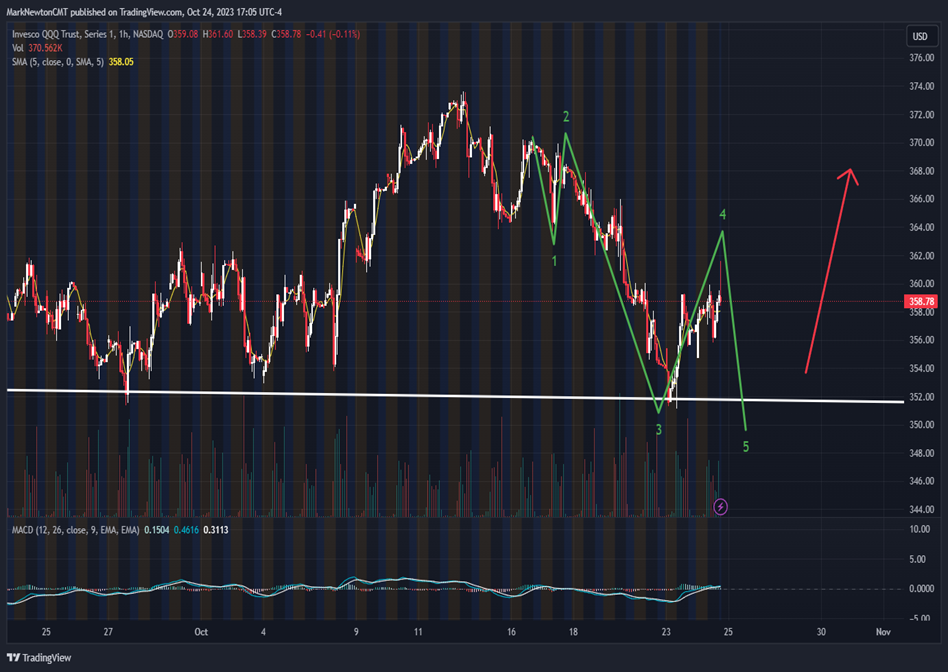
As shown below, the first move from mid-October peaks appeared like a three-wave decline. This was followed by a bounce, then QQQ fell in what appears to be a not-completed five-wave decline.
Overall, 351 for QQQ is important. Movement under this level could allow for short-term weakness to persist, though would arguably be quite close to a trading low. ( I do not expect 339 will be broken into late November.) To be positive on QQQ, price needs to get back above $364 on a weekly close.
Finally, while both US Dollar and US Treasury yields have given initial evidence of trying to top out, (which should be helpful and a necessary tailwind for an Equity rally) more is necessary before weighing in that the trends have turned negative.
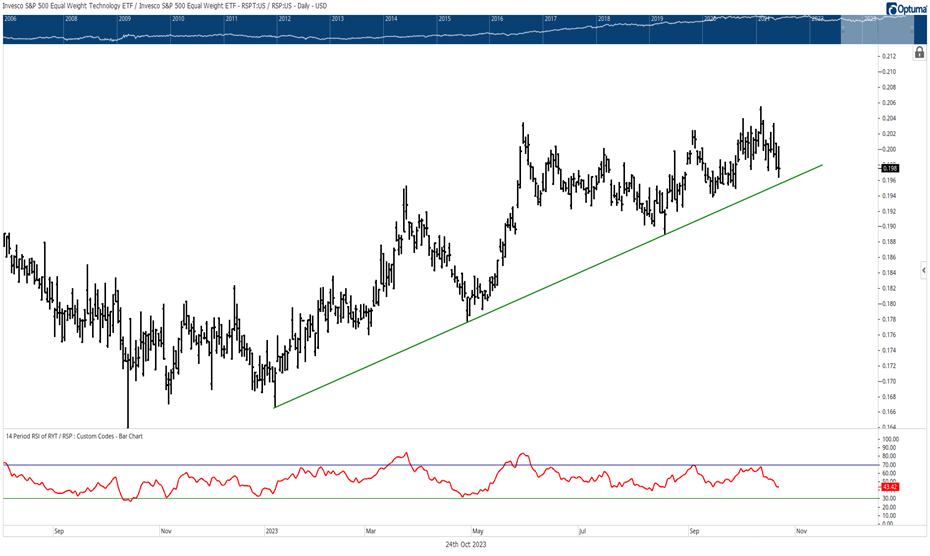
Technology still trending higher vs. S&P 500
The chart below is another way of looking at a chart which I showed last night of QQQ vs. SPX. When viewing Equal-weighted Technology vs. Equal-weighted S&P 500, this also is trending higher, and minor weakness in Tech over the past month has not violated the relative chart vs. SPX.
This relative trend started to strengthen meaningfully back in January when Technology began to emerge. Until/unless this ongoing uptrend from January 2023 is broken, then it’s right to buy dips and still expect a push back to new relative highs vs. the market.
At present, despite the so-called “Magnificent 7” stocks (NVDA -2.88% , TSLA -2.07% , META -0.75% , MSFT -2.72% , AAPL -0.01% , AMZN -4.39% , and GOOGL -0.19% ) having worked well relative to the broader market and subsequently having garnered more and more public attention, I find it difficult to avoid this group and Technology as a whole, relative to SPX, without any proof.
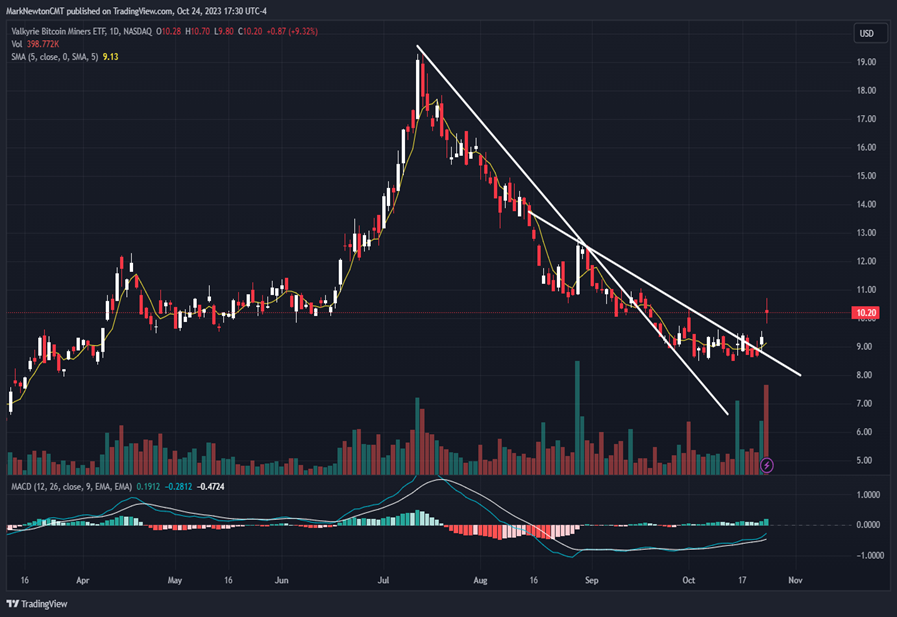
Bitcoin Miners have begun to turn higher sharply given recent boost in Cryptocurrencies
Bitcoin along with many other Cryptocurrencies have turned sharply higher in recent weeks, despite the drawdown in Equities.
The Bitcoin miners, shown by the Valkyrie Bitcoin Miners ETF, WGMI 2.22% , moved to new multi-week highs on Tuesday on much heavier volume.
I’ll skip the discussion of Bitcoin which I’ll leave to our Crypto team led by Sean Farrell, and concentrate solely on Bitcoin-related Equities which have begun to perk up in recent days following BTCUSD move above $30,000. (My own comments on Bitcoin and Bitcoin’s Dominance chart is available in recent reports of our Digital Assets team. I submit technical comments daily to the daily report)
Near-term, these Cryptocurrency stocks look attractive for gains in the days ahead, and WGMI as a gauge for the sector, should rise to technical targets near $12.75 initially, and then $14 without too much trouble.
Following a lift into November, I anticipate some consolidation, which likely will find support before much technical deterioration and show further strength into year-end. Overall, following a difficult few months for Cryptocurrency stocks, I find this week’s price action constructive, and expect this can continue.
Energy weakness looks technically damaging and might result in short-term weakness into late November
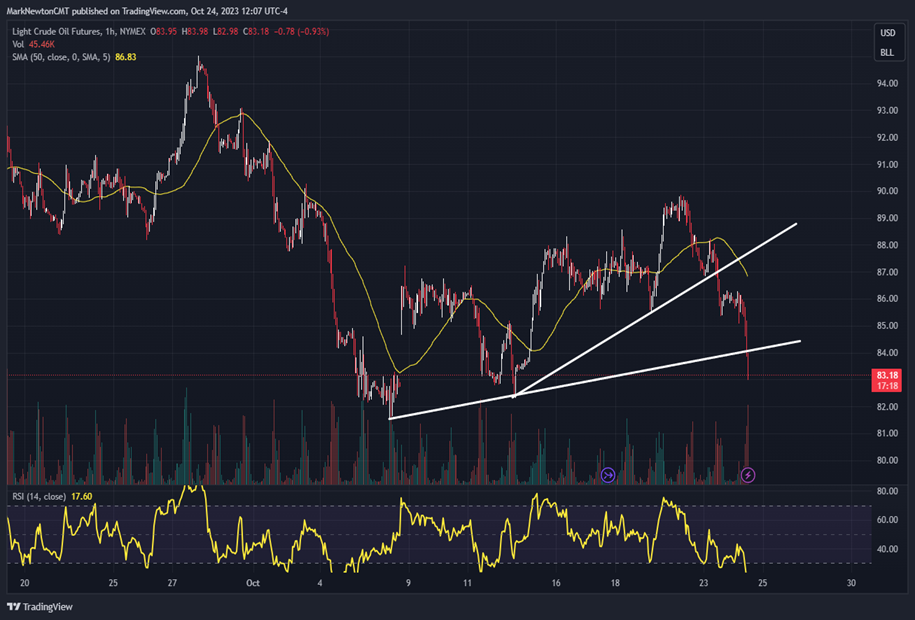
Crude oil’s decline in recent weeks looks technically damaging to both price trends and momentum and could lead to additional weakness into late November before a meaningful low.
For those concerned about near-term price action, I suspect that WTI Crude very likely can reach the mid-$70’s into late November. However, this should provide a very attractive risk/reward opportunity for WTI Crude to push higher into next year.
Seasonality remains quite bearish for WTI Crude, as October and November have proven to be the worst two-month stretch for Crude over the past 10 years.
For those that recall my January 2023 sector list to be overweighted, Energy was one of the four sectors I expected to outperform this year. I’m making no changes at this time, as I expect 2024 might emerge as another very good year for Energy, and I have an intermediate-term focus with regards to these sector bets.
However, weekly closes under $81.50 for generic WTI Crude futures should lead to $75 and potentially the low $70’s before this turns back higher. This lines up near a 61.8% Fibonacci retracement area for Generic WTI Crude futures based on the rally from May into September of this year. Furthermore, a decline to $77, would allow this most recent pullback from 10/20/23 to equal the length of the initial decline from late September.
At present, XLE and OIH look interchangeable technically in the near-term. However, XLE looks like a definite laggard to OIH 0.61% and is not preferred as much. Interestingly enough, despite WTI Crude’s sharp fall lately, XOP is still maintaining its uptrend vs OIH and is still preferred.
I will share my cycle projections on Crude, and by extension a possible course for Energy, in tomorrow’s report.