
US Equity indices and Treasury yields remain quite choppy, but the weakness coinciding with Yields pushing up still looks to extend into next week. Trends and momentum are short-term negative, and the breakdown to multi-day lows likely results in a bit more technical deterioration into next week. Only on a TNX break under 4.05% would it be right to trust an Equity bounce in September
As this week comes to a close, US and Sovereign bond yields have continued to press higher. German and Italian 30 year yields have reached the highest levels in more than a decade, and US yields have also achieved the highest weekly closes since 2007.
This breakdown has adversely affected Technology this week, and Equity indices are thought to be vulnerable with Yields pressing higher.
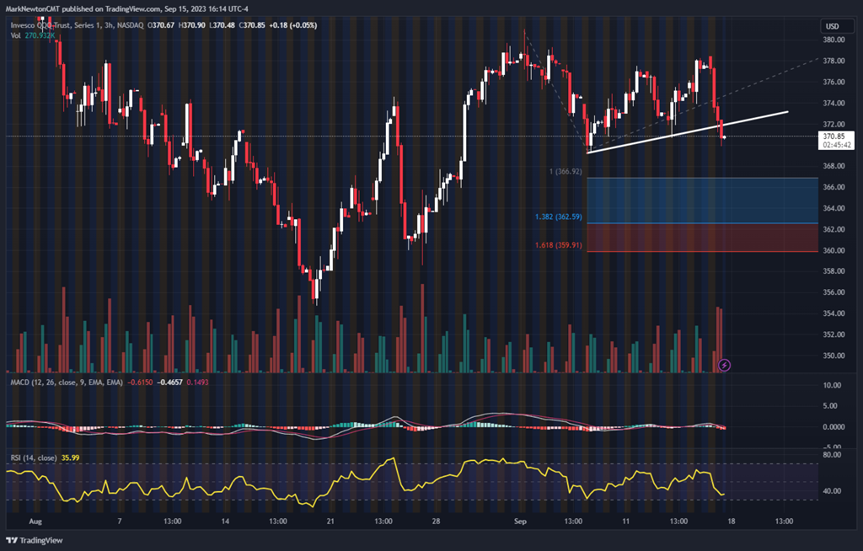
Overall, the break of QQQ-372 looks short-term damaging to technical structure, as seen by daily charts along with hourly (below).
Until/unless this can be immediately recouped, Friday’s minor support violation of this past week’s stabilization efforts looks to have failed.
9/7/23’s intra-day lows of $369.14 look important to hold over the next week. Movement to violate this level would argue for a pullback to $360-2 which would be the only area of real support ahead of a possible test of August lows near $354.70.
Similar levels for S&P 500 lie at 4430, and under this would result in a likely test of 4400-3 and then 4362.
Important areas on the upside, which if exceeded, would serve to turn the trend back positive lie at SPX- 4541 and QQQ-381.
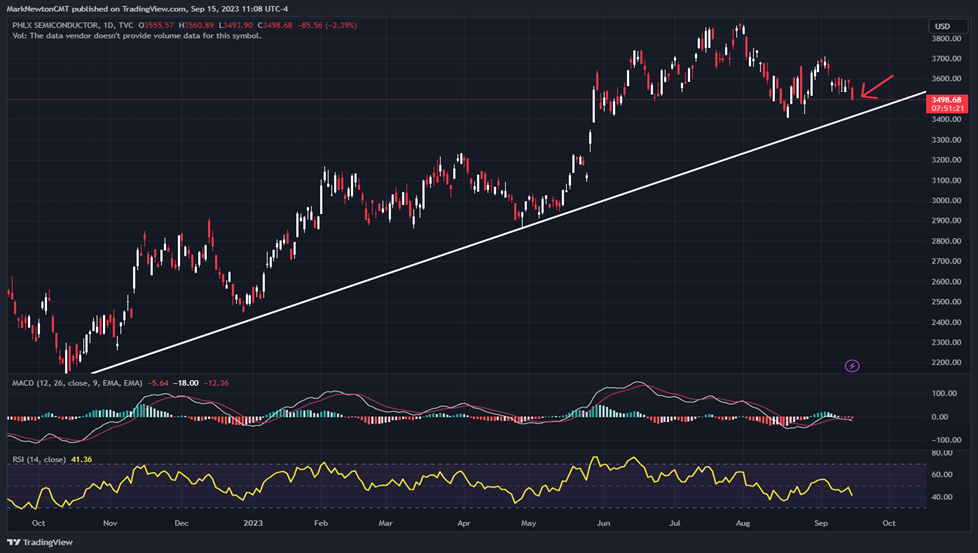
Semiconductor stocks likely will weaken to test August lows given Friday’s (9/15) breakdown
Friday’s decline, which undercut former lows from this past week, looks bearish for the next 2-3 days in Semiconductor issues. (Philadelphia Semiconductor index (SOX) shown below).
This remains short-term weakness only as prices are still trending higher on an intermediate-term basis as part of an uptrend from last October 2022 lows.
Until $3400 is broken in SOX, this decline looks temporary and could create an attractive risk/reward heading into next week.
Breaks of 3400, however, similar to a break in $172 in AAPL -0.07% , would be a negative technical development, likely leading to weakness to 3250, or below to $3068.
A rally back above 3700 could postpone this weakness, but looks unlikely in the immediate future.
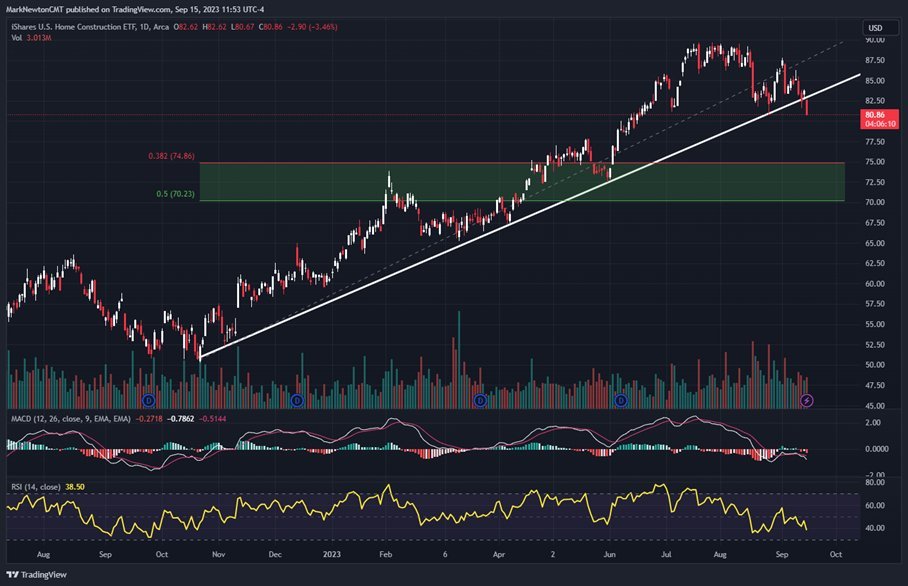
Home Construction ETF has violated intermediate-term uptrend from 2022 lows
ITB -0.56% , the Ishares US Home Construction ETF, has just made the lowest weekly close since June, violating its 11-month uptrend in the process.
While price managed to hold August lows as of Friday’s (9/15) close, the act of ITB finishing near the lows of the week and violating this uptrend on above-average volume is thought to be a technical negative.
Weakness down to $73-$75 cannot be ruled out, and this area would be the first meaningful area of downside support for ITB.
Until/unless $86.25 can be immediately recouped, Friday’s decline is thought to be a bearish development for Homebuilding and Home Construction stocks.
While the break of an 11-month trendline is normally a negative, this decline in ITB very well might materialize into a three-wave ABC-type pattern only from an Elliott perspective before returning to highs. At present, it’s difficult to have faith in ITB bottoming right away given the upward pressure on Treasury yields.
However, given my technical thoughts of a possible intermediate-term top growing closer for yields, it looks right to consider ITB on any pullback to the mid-$70’s which could serve as strong support on declines.
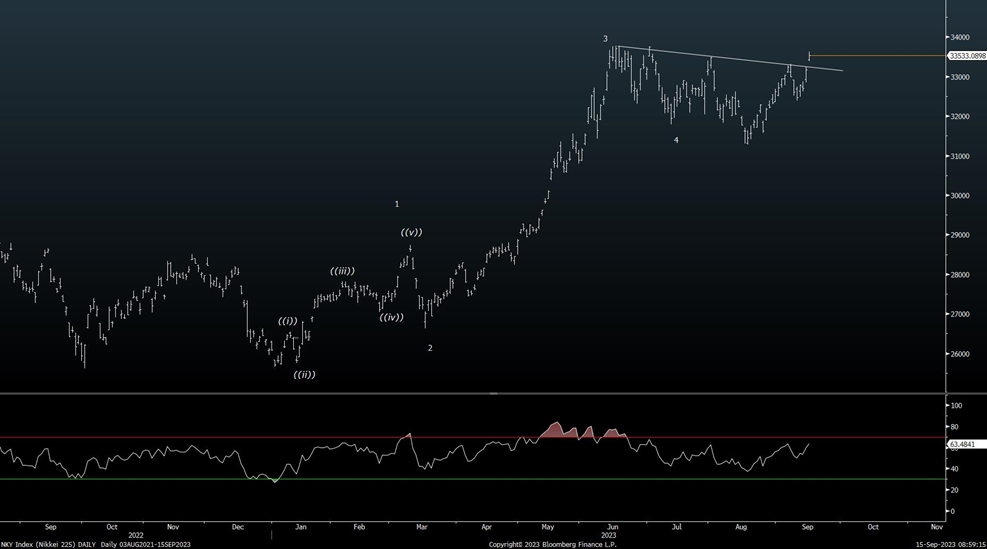
Japanese NIKKEI 225 index has just broken out
One piece of positive news concerns the movement in NKY which has just exceeded its minor resistance trendline drawn from Spring 2023 highs.
This looks to be the final wave higher of a five-wave advance which began back in early January 2023.
Despite thoughts of an eventual further intervention to attempt to cushion the Japanese Yen’s decline, this still looks premature, technically speaking, and further gains over 150 appear likely.
Thus, a rally in NKY likely might reach 35,718, or above at 36,760-37,000.
A continued advance to test all-time highs from 1989 might be unlikely at this time (38,957) but the trend has improved this week, and looks to extend in the weeks to come.
A combination of EWJ -0.04% and DXJ 0.39% looks proper as vehicles which might allow for exposure to participate in the NKY’s advance. However, my thinking is the Yen’s decline likely should not last more than another 1-2 months before finding strong support and turning back higher. Thus, EWJ (IShares MSCI Japan Index Fund) might prove to be a better intermediate-term technical choice, vs DXJ, the Wisdomtree Japan Hedged Equity Fund.