US Equity indices and Treasury yields remain quite choppy, but the path of least resistance remains lower over the final couple weeks of September. Treasury yields look likely to break out to new 2023 highs, and I suspect this will be short-term negative for Equities. Only on a ^TNX break under 4.05% would it be right to trust an Equity bounce in Sept.
S&P’s range-bound pattern remains intact, and it’s difficult to make a strong case for any directional movement, though a few clues remain present to consider:
Yields remain within striking distance of 2023 highs, and this has been a bearish factor for Equities in recent months.
Short-term structure looks bearish based on Elliott-wave patterns. Moreover, momentum is negatively sloped on daily and weekly charts.
Seasonality suggests that September might still prove difficult given intra-month tendencies.
Cycles show that US Equity markets likely will remain under pressure until after September expiration, while other composites show a low in October.
US Dollar and Treasury Yield DeMark-based exhaustion on weekly charts seems to suggest possible weekly exhaustion in 2-3 weeks. Given recent correlation trends, this should seem to indicate that DXY and ^TNX could hold up until October. Meanwhile, monthly TLT chart exhaustion likely will not appear until November.
Technology remains the key for US Equities. For now, Tech has held up admirably on an absolute and relative basis, yet some minor cracks have appeared in Software and also Hardware stocks such as AAPL -0.44% .
Technically speaking, I am taking a near-term defensive stance given the downward sloping nature of S&P Cycles this month along with the resilience in Treasury yields, which are very close to breaking out to new monthly highs.
This week’s critical SPX areas lie at the following levels:
Support: 4451, 4430, 4335, 4260
Resistance: 4541, 4600
Breaks of either 4541 to the upside, or 4451 to the downside, should be important.
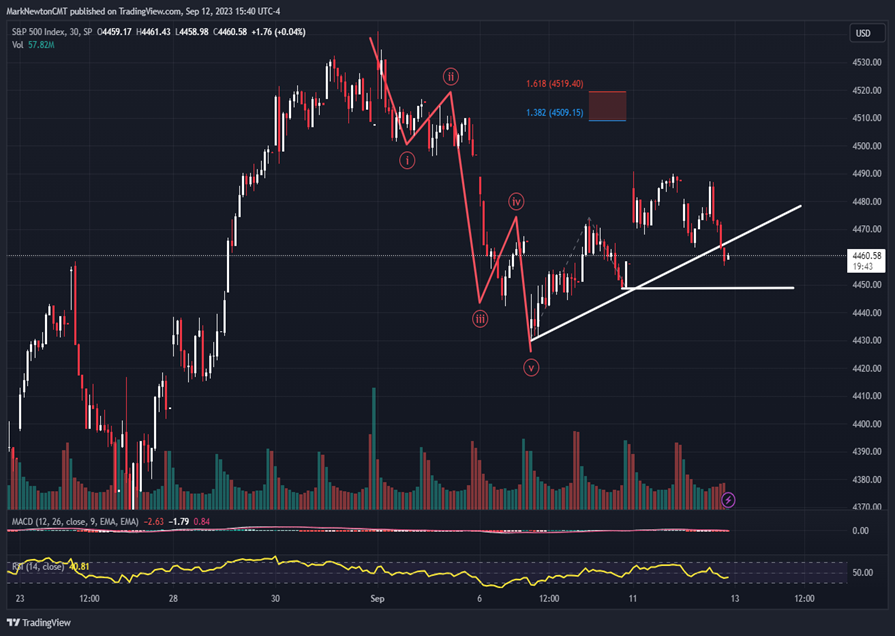
The hourly S&P Futures chart shows prices having broken the minor uptrend from late last week. This doesn’t necessarily suggest an imminent drawdown until/unless 4451 is broken.
However, it’s plain to see how fluid and non-overlapping this decline from 9/1 proved to be, vs. the subsequent bounce, which has been largely choppy and overlapping.
Overall, that’s not a great sign technically for a move back to monthly highs just yet. Conversely, this suggests that upside might prove limited and give way to another decline which might represent a ratio of the decline from 9/1.
Software’s weakness should make this group attractive upon further weakness into October
ORCL’s 12% decline proved to be a difficult development for Software, which had shown tremendous relative strength within Technology for most of 2023 thus far.
Other software names like ADBE -0.02% , PANW 0.43% , ADSK 0.79% , ACN 1.64% , NOW 0.36% all fell more than 2.5% in trading on Tuesday.
Relatively speaking, Software has outperformed within Technology since January of this year, and has started to pick up strength compared to other sectors like Semiconductors and Tech Hardware in recent months.
On an intermediate-term basis, Software has underperformed Semiconductor sector since 2019. However, its momentum has picked up relatively speaking, and a move back over $370 in IGV would likely help Software begin a period of intermediate-term outperformance. At present, this remains premature.
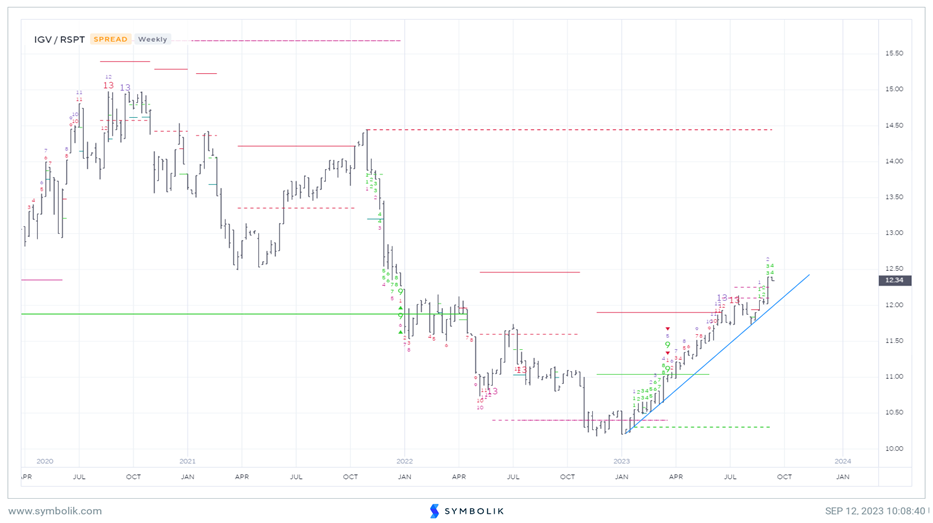
Below lies a chart of Software vs. Equal-weighted Technology, shown as IGV 0.42% , vs. RSPT -0.04% . Weekly DeMark exhaustion remains quite premature as per the current 9-13-9 setup, and it’s likely that Software outperforms within Tech through the balance of 2023. However, the near-term deterioration based on Tuesday’s (9/12) decline might result in 2-3 weeks of temporary weakness.
This remains technically attractive, and any further weakness in Software in the weeks ahead would make this a more appealing risk/reward opportunity within Technology. Pullbacks to $340-$350 for IGV likely represent near-term technical support.
Oracle’s weakness could fall to $100-$105. However, this would make the stock quite attractive technically
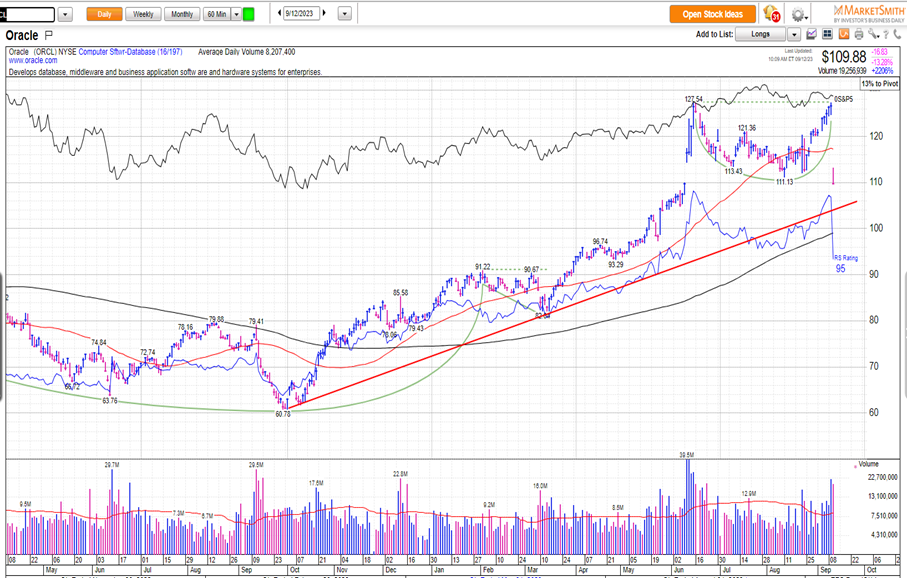
Oracle’s (ORCL -1.80% ) gapdown is the largest since March 2020, and occurring on very heavy volume, which has technically broken to the lowest levels since June.
Technically speaking, short-term trends remain negative given Tuesday’s high-volume gap down, and ORCL likely works lower in Sept/Oct down to 105 which represents first meaningful support on a further decline.
(This represents a 50% retracement of the rally from March 2023 lows. Note that the pattern from June peaks was very much a 3-wave decline and now today’s (9/12) decline makes the former rally from mid-August also a 3-wave decline.)
(Additional support lies near $100, which lies just above the 61.8% Fibonacci retracement area of the prior March-September 2023 rally)
Thus, a five-wave decline is likely to complete an ABC corrective pullback, which then should be followed by a push back to new all-time highs. While monthly DeMark indicators show unconfirmed 13 exhaustion, there is nothing yet present on weekly charts, so I expect an initial retest of ORCL -1.80% uptrend from 2022, and 105 down to 100 makes sense as an initial zone of downside support.
Energy growing closer to near-term resistance
While fundamental supply/demand data seems to be getting increasingly more positive for supply/demand in oil, the Energy sector looks to be nearing its first important upside test.
OPEC+ indicated on Tuesday (9/12) that world oil inventories could be set for an even steeper drop of roughly 3.3 million barrels a day in the next three months.
WTI Crude (front month) Futures broke out above the highs of the last five days of consolidation on this bullish news Tuesday.
Energy showed positive performance of more than 2% on Tuesday, led by strong gains out of OXY 2.38% , MRO, APA 0.47% , EOG 0.39% which all rose more than 3% in trading.
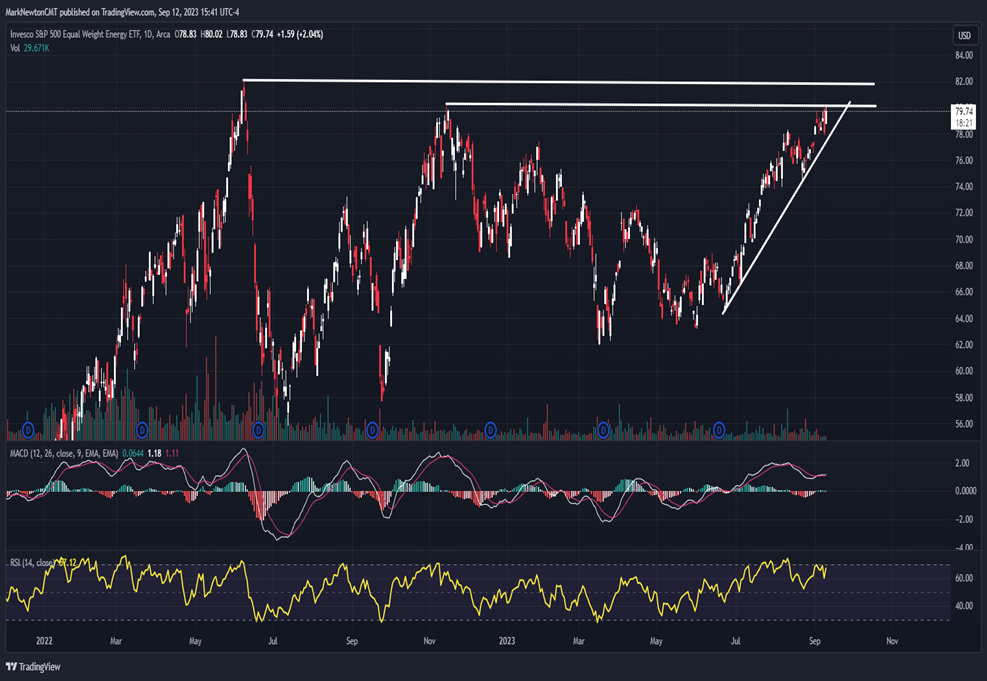
As seen below, the Equal-weighted Energy ETF by Invesco (RYE 1.20% ) is now within striking distance of last Spring’s peaks.
Technically, I suspect this area in the low $80’s should hold on the first test from RYE 1.20% sometime in the next week. While price looks likely to push above the peaks from last November 2022, it shouldn’t be able to surpass Spring 2022 peaks all that easily.
DeMark indicators might show a confluence of upside exhaustion on Crude front month futures charts on daily basis this week. However, it’s a must to watch how RSPG reacts as it climbs above $80. My thinking is this stalls out and gives way to minor weakness.
At present, nothing is confirmed, and Energy remains one of the strongest, if not the strongest, of any of the major sectors.
My favorite Energy names are RRC 2.31% , MPC 0.54% , OXY 2.38% , VLO -0.22% and LNG -0.06%