
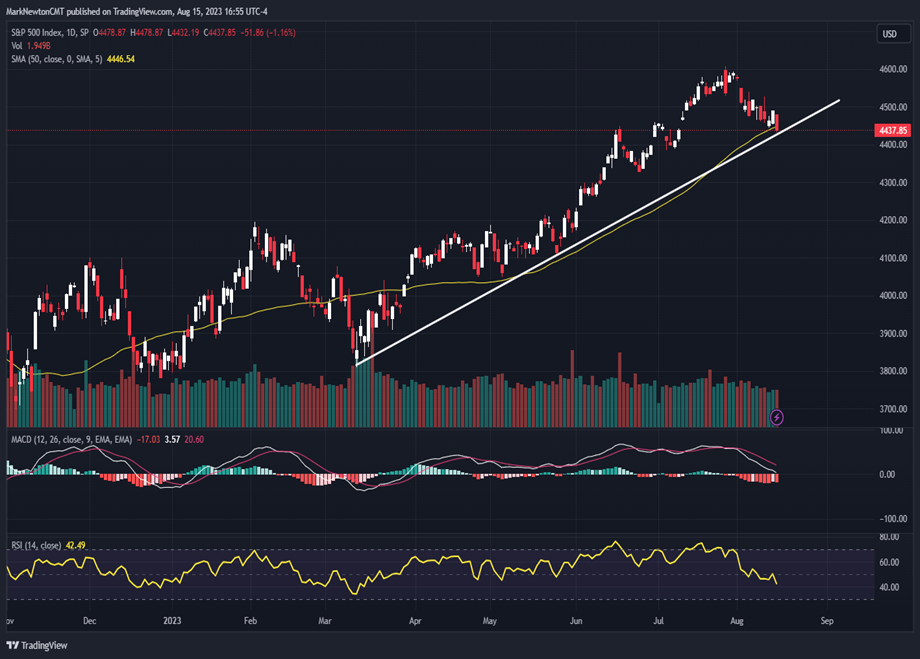
Markets have entered a window for potential low, but thus far have not turned according to pre-election year August seasonality nor DeMark’s completed TD Buy Setups. While Tuesday’s close certainly looked negative, I doubt that SPX takes out 4400 on this first pullback from July peaks. Lows still seem near, and uptrends remain intact.
A few pertinent comments:
Breadth has gotten a bit worse on recent selling over the last few days as the former underperformance in Tech and Industrials has now given way to underperformance in Discretionary, Financials, and Materials
Equity markets have not yet bottomed on schedule despite pre-election year seasonality pointing to intra-month trends normally bottoming on the 10th day of the month
SPX is now down to its trendline extending from March lows. This means more as a positive than the negatives of a 50-day moving average (m.a.) violation by SPX which most Financial media are exclaiming that Technical students find negative. (Note that both prior occasions from December 2022 and March 2023 both proved remarkably short-lived and non-conclusive) The 50-day m.a. is actually quite a bit more positive and steeper in slope now than it was six months ago)
Technology has relatively outperformed SPX when eyeing XLK -1.96% . Other groups like Discretionary, Financials and Materials have all underperformed Technology over the past week. (this is seen as a bullish development)
DeMark based exhaustion (for those who utilize counter-trend tools) now show a completed TD Buy Setup on daily charts of SPX, QQQ and SOX while showing TD 13 Countdown signals (Buys) on 60-minute and 120-minute charts
QQQ has diverged positively from SPX in recent days. While SPX closed at the lowest levels since early July, QQQ remains above 8/11 intra-day lows. (This is a positive)
Treasury Yields and the US Dollar remain both near resistance, while sentiment has become more negative about the prospects for Treasuries (rates going higher) in the last week. Technically, yields are close to resistance and upside looks miniscule for yields and DXY.
Cycle composites on daily SPX charts show a bottom by end of August and a sharp turn higher into September. Given that this cycle correctly predicted August weakness, it’s worth noting that this bottoms in 2 weeks and turns back higher. (Note, this two-week timeframe also could allow for weekly DeMark exhaustion signals to appear on ^TNX and TYX which adds to the thinking of a reversal back higher in both Treasuries and Equities by the end of August)
SPX daily chart below shows prices down near five-month uptrends.
I doubt that this will be forcibly broken given the presence of TD Buy Setups, though 4400 could certainly be tested briefly before reversing higher.
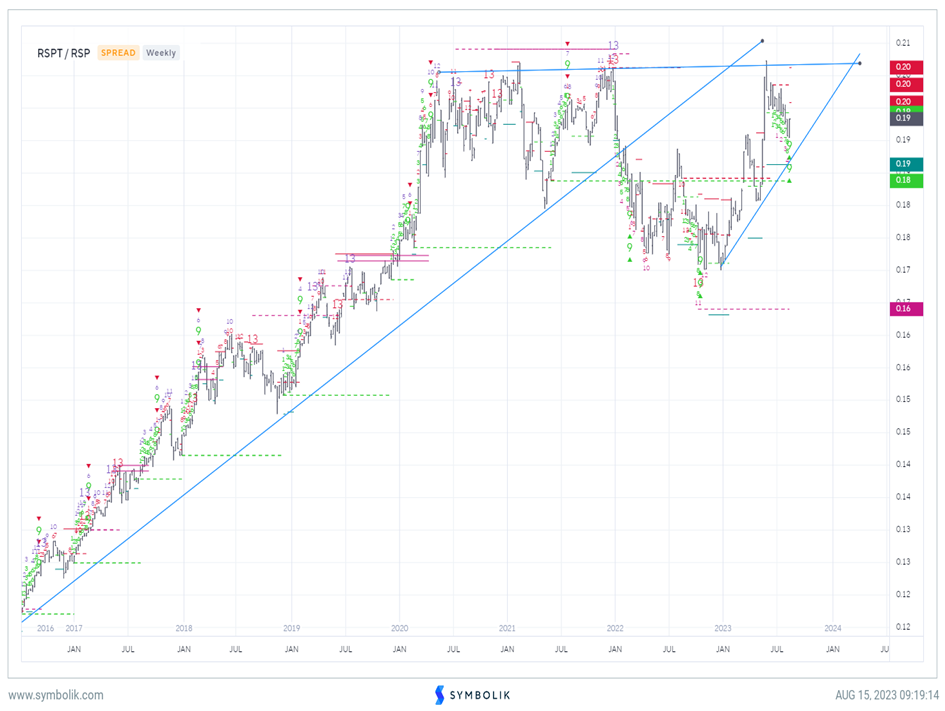
Technology has pulled back to attractive levels relative to the Equal-weighted S&P 500
Technology’s mild underperformance over the last month (-2.23% in RSPT -1.44% vs. -1.50% in SPX) has not broken uptrends to suggest a lengthier period of Technology underperformance.
Weekly charts show this sector to have pulled back to attractive levels to buy after recent weakness.
Many market watchers can attest that Large-cap Technology has outperformed other areas of the market like Financials, Discretionary and Materials of late.
The bigger picture for Tech remains quite positive. Relative trends remain upward sloping for 2023 relative to S&P 500. Furthermore, despite some stalling out near prior peaks in relative terms (2020-2021 peaks vs SPX) the bigger picture has not turned down to suggest Technology should likely weaken.
This is important given that Technology remains the largest sector within S&P 500. Overall, I expect a shift back to Technology by September at the latest as an outperforming sector, and relative highs vs SPX could very well be tested in the months ahead.
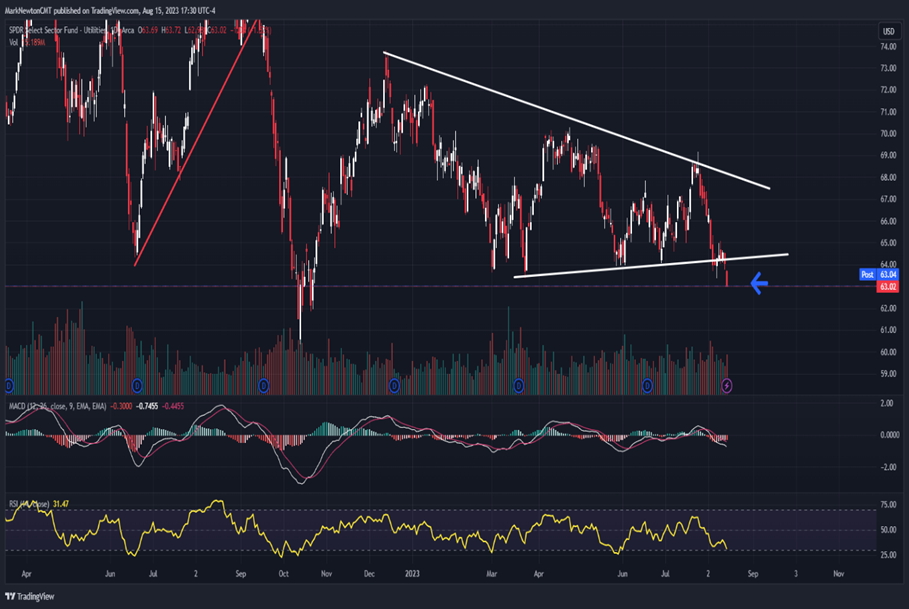
Utilities have broken down despite US equities weakening
XLU -0.22% has just hit the lowest levels since Fall 2022
This is a bearish breakdown of former consolidation support which had been building since December 2022
This weakness has been joined by the REITS, and part of the underperformance is thought to be yield related, as these two yield sensitive groups have underperformed with Treasury yields pushing higher.
Overall, given my thinking of yields close to peaking out and Equities bottoming, this doesn’t give conclusive evidence for why one would buy dips in Utilities. A return to risk-on positioning is normally bearish for the “Utes”. Yet, a softening in yields could benefit XLU -0.22% .
Bottom line, it’s worth just keeping this daily chart on the front burner, as trends have turned more negative as a result of Tuesday’s breakdown. It will take a reversal back above $65 in XLU to have confidence that this might have bottomed. Unfortunately, this trend has gotten worse, not better.
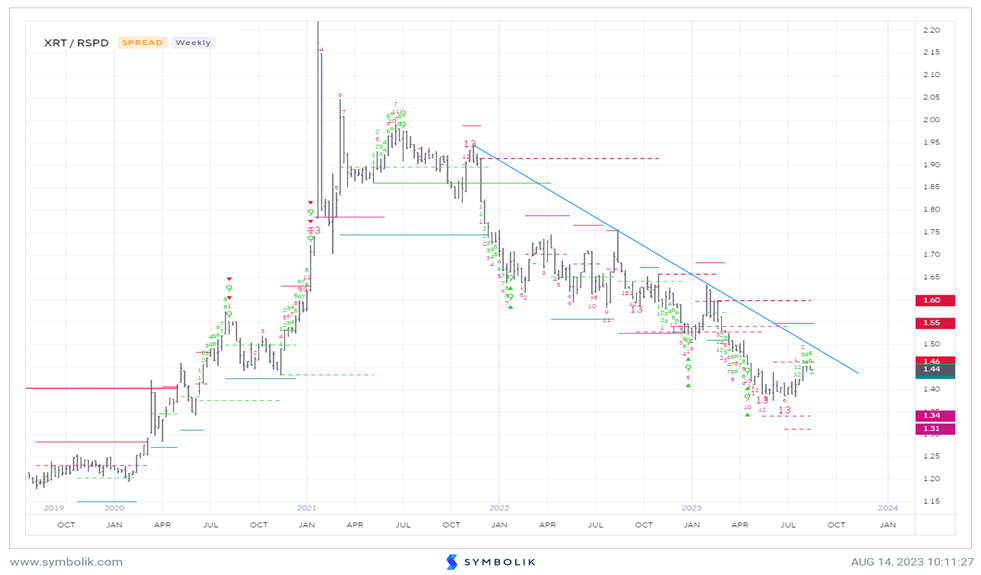
Retail has relatively outperformed Consumer Discretionary over the last month; However, intermediate-term trends remain negative, making selectivity important
Retail earnings are in full swing this week. However, it’s worth knowing that this sub-group has largely underperformed the broader Consumer Discretionary space over the last few years.
Groups like Homebuilders/Home Improvement stocks, Casinos, Hotels have all proven to be much better than Retail.
However, there were some brief signs of optimism back in July when the relative charts for XRT -2.93% (SPDR S&P Retail ETF) signaled DeMark-based weekly exhaustion vs. Invesco’s Equal-weighted Consumer Discretionary ETF (RCD -1.67% ) This provided some outperformance over the last month within Retail . However, much of this were strong absolute gains by stocks like BKNG, VFC, NWL, TSCO, and KMX which all gained between +2.00% to +11.7% on a rolling one-month basis.
Importantly, Retail is not a group to favor technically relative to the broader Discretionary sector unless this can achieve a relative breakout.
I’ll discuss some of my favorite Retail names in tomorrow’s report (Part 2 of Retail discussion.) At present, XRT looks attractive at/near $64 following its pullback from $68 and likely should bottom near its 50-day moving average and try to bounce. Former highs near $76 would be in play if $68 can be exceeded (which I don’t expect needs to happen right away)
Overall, the key takeaway is that Retail has shown some relative outperformance lately; However, more is necessary to have proof of this working well technically. Selectivity remains quite important at this stage of the market rally from last October 2022 lows.