This week’s market sell-off on renewed tariff concerns has understandably alarmed investors to reduce risk and seek safety.
However, what I find interesting technically is that this risk-off move continues to track the 2016 market cycle surprisingly well and suggests the correction window will likely be short-lived.
As readers here may recall, the 2016 roadmap was an excellent guide navigating the ebb and flow through late Q1 into early Q3. Until I see the technical data notably diverge, the 2016 analog should prove helpful through YE into 2020.
Let’s compare the current technical Q3 set-up with Q3 2016 and think about what it might mean for the S&P through year-end. In the summer of 2016, the S&P made marginal new highs only to begin a correction in August (sound familiar?) that conveniently bottomed in at the 40-week (200-day) moving average.
A similar correction this Q3 would imply a pullback toward 2780 (-5%) which is also near support at the Q2 lows of 2728. In addition, the proprietary momentum indicator in the bottom panel, tracking the percentage of S&P 500 stocks with positive weekly momentum, is also following the Q3 2016 pattern peaking just above 50%. (See below.)
I’ll be looking for this indicator to unwind back to oversold territory over the coming 6- 8 weeks, which, and I’m speculating of course, could be just the right amount of time to resolve the tariff dispute.
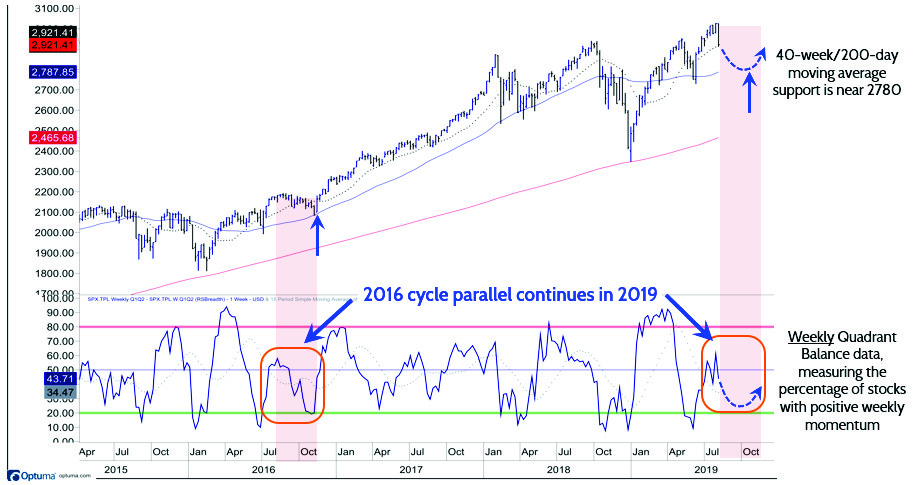
Weekly momentum oscillator continues to track 2016 cycle suggesting shallow seasonal pullback into late Q3-early Q4)
Source: FS Insight, Bloomberg, Optuma
So, as unnerving as this week’s market weakness feels, my expectation is that the S&P will track a similar path through the seasonally weak Q3 as it did in 2016. I fully appreciate many of you may be skeptical of such a simple analogy, but so far, the longerterm, multi-year market cycle remains bullish, with seasonal weakness in Q3 fairly common.
Bottom line: Remain patient through the current pullback and be prepared to add to add more cyclical exposure later in Q3 and early Q4.