Markets have entered a window for potential short-term trend change, but do not expect much selling until August. Near-term, an SPX-4500-4620 range might hold into last couple days of July before weakening down to 4350-4400 into mid-August before rally continues
While US Equity markets showed roller-coaster type volatility following the Fed’s rate hike to new 22-year highs, Powell’s language sent a clear message that June’s pause should not be interpreted as the end of the cycle or the start of a “one-month on, one-month off” type policy.
Fed swaps right now are pricing in a 50% chance of another rate hike, and these odds very well could rise if rapidly rising gasoline prices cause any kind of rise in inflation.
Technically, the key takeaways involved the strength in Financials following FOMC’s assertion that the Banking system remains “sound and resilient”(Powell) Stocks like ZION 1.48% , KEY 1.13% , CMA 1.06% , and CB -0.70% all rose more than 5% in Wednesday’s session.
However, it was the strength of the large-cap Industrials that warrants discussion, as UNP jumped up 10% Wednesday, while BA -0.89% and ODFL 0.33% both rose more than 6%. (Boeing actually broke out of its multi-month base) Meanwhile, DJ Transportation Average rose more than 2.5% on the day, while the DJIA pressed higher for a record 13th straight session.
Thus, when looking “under the hood” markets actually proved to turn out a much stronger session than what might be initially gleaned from studying the end of day closes on ^SPX or QQQ 1.14% .
Importantly, the lack of selling pressure post FOMC does not signal that trends have a greater than average probably of continuing to extend in the weeks to come. Specific to this point, both Financials and the ^SPX itself now show daily counter-trend upside exhaustion signals (TD 13 Countdown “sells”) which argue for a coming stalling out and reversal, not a continued rally.
Yet, also as I’ve discussed in these reports, any warnings regarding cycles, DeMark exhaustion, drying up in breadth, or bullish sentiment mean little to nothing without an actual trend reversal. Price confirmation, after all, continues to be the most important factor to watch. Trends continue to trend upward, with higher highs and higher lows. Until markets show actual evidence of trend change, it will continue to be right to stick with this rally.
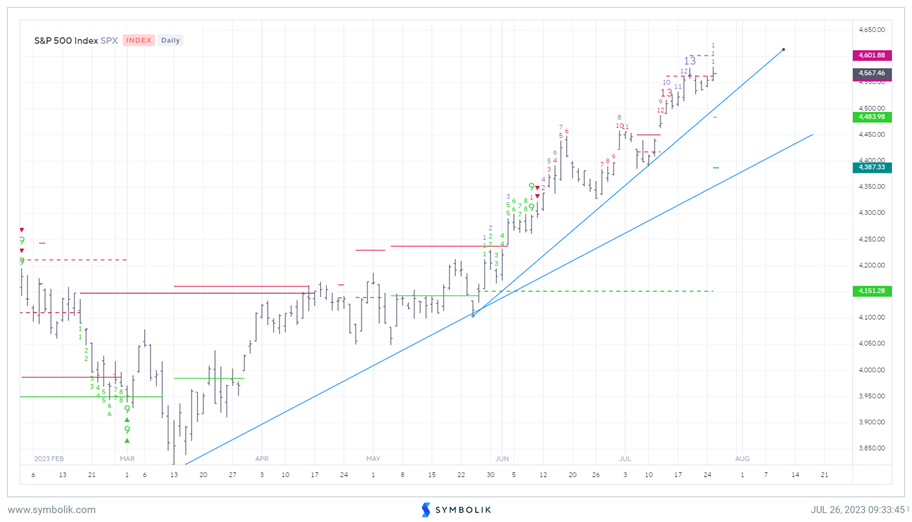
At present, volatility remains lacking. My former comment regarding a 4500-4620 trading range remains my current thinking, and this hasn’t changed. SPX will require a break of this range to have any concern about volatility starting to pick up.
Overall, this might be postponed until the first week of August. Bottom line, the lack of meaningful downside follow-through this week does not postpone nor eliminate the likelihood of trend reversal. Markets remain in a key window for trend change, and both Financials, Industrials and Consumer Discretionary have gotten stretched. Meanwhile, Technology’s wobble hasn’t been properly restored as of yet. Despite the bullish price action in stocks like GOOGL 2.24% (quite important percentage wise in the indices) others like MSFT -1.09% , TXN 2.88% and EBAY -0.95% disappointed) (After-hours trading showed strong gains in META 1.96% , while NOW -1.26% fell) SPX daily charts below show 4500 to also line up with the most recent uptrend from May.
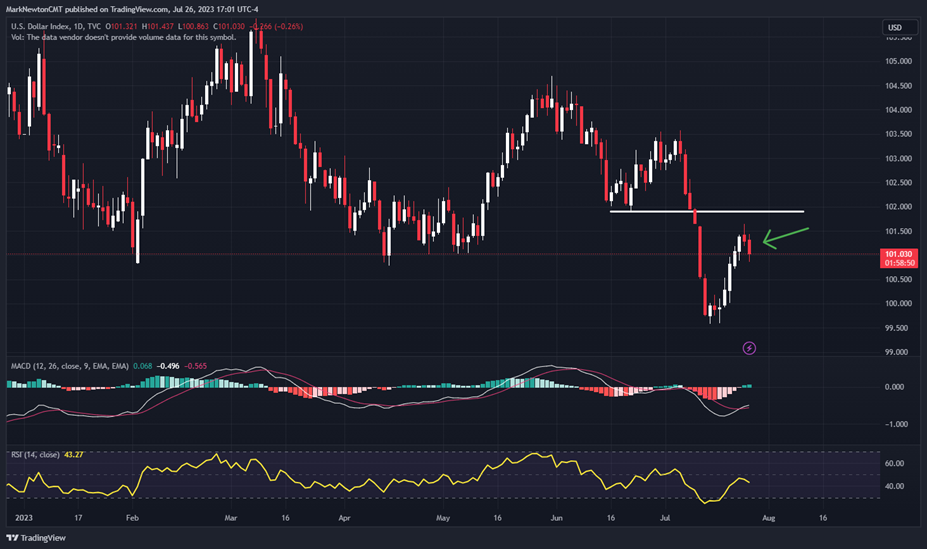
US Dollar and US Treasury yields both turn lower post FOMC
While not an economist by trade, one of the key technical developments following Wednesday’s FOMC decision centered around something I’ve discussed in these reports over the past week:
Both US Dollar along with US Treasury yields should be in the process of turning lower, and Wednesday’s about-face could have been the start of this move. Some might attribute this to the FOMC keeping optionality open on further hikes, claiming data dependency, along with Chair Powell saying that a pause is “certainly possible”.
Meanwhile, the ECB very well could hike quite a few more times. Thus, the DXY weakening might make sense in the weeks/month to come.
Technically, I expect DXY to decline to $97.50, and this likely happens in the months to come. This should help Emerging markets and commodities to gain further ground, and increasingly, China looks to be starting to strengthen, which looks likely to continue.
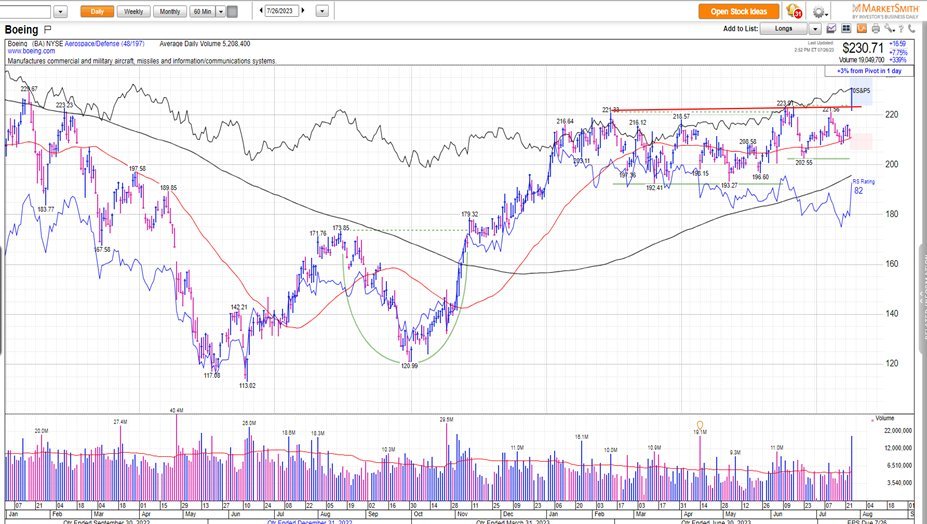
Boeing finally breaks out of its lengthy six-month range
Boeing’s breakout looks to be meaningful technically given its importance within the Industrials complex. BA -0.89% had moved sideways in consolidation since January of this year.
A tight consolidation following its lengthy run-up helped momentum drip from weekly overbought conditions which were present back in early 2023.
Wednesday’s breakout happened on the highest volume in over six months, as BA reached heights not seen since November 2022.
Technically, this looks like a bullish development for BA and should allow for the start of a push back to challenge all-time highs from Spring 2021. While this likely does not happen in a straight line, Wednesday’s surge is a clear technical positive, and makes this an appealing technical long on an intermediate-term basis. See the daily BA -0.89% chart below.
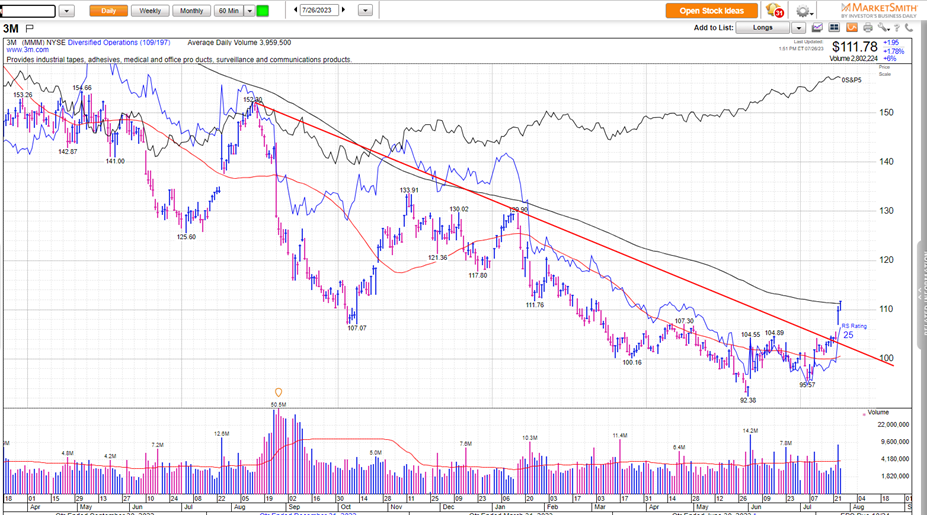
MMM has just exceeded its two-year downtrend
Industrials also looks to be benefiting from mean reversion rallies in some of the laggards in the group, namely MMM 2.18% which broke out of a two-year downtrend this week on above-average volume.
While other DJIA stocks like PFE, DIS, WBA, VZ still remain lower by more than 20% off their respective 52-week highs and have not shown evidence of turning back higher, this week’s rally in MMM looks important and positive towards signaling a meaningful trend change.
Other key Industrials names like UNP -1.29% , BA -0.89% , ODFL 0.33% also gained more than 6% in Wednesday’s session and all look more bullish than these stocks appeared a few weeks ago.
Importantly, this isn’t the start of Industrials kicking into gear, but rather the start of some mean reversion from former laggards which had not shown tremendous strength of late. ODFL 0.33% (not shown) has just exceeded the highs of an 18-month Cup and Handle pattern, and its breakout this week occurred on above-average volume.
While I expect that Industrials should lead in relative performance for 2H 2023 and into 2024, this might require some consolidation following the sharp movement in many names. DeMark indicators show the Equal-weighted Industrials ETF (RGI 0.85% ) by Invesco to show a weekly “9 count” or TD Sell Setup, which often suggests a minor pause following the degree of recent strength.
At present, Industrials remains a sector Overweight for me technically, and I expect that MMM has made a meaningful bottom given this week’s progress.