
Markets have entered a window for potential short-term trend change, but do not expect much selling until August. Near-term, an SPX-4500-4620 range might hold into last couple days of July before weakening down to 4350-4400 into mid-August before rally continues.
SPX does not look to have peaked, and the range discussed last week remains very much intact, and could remain so until end of month, whereby it’s expected that a pullback in Equities might get underway.
Financials and Energy, two of the more recent outperformers, both gained ground in Monday’s trading. Energy looks quite positive for the weeks to come. Financials, on the other hand, looks closer to stalling out, and it’s thought that the Regional Bank rally might “run out of steam” technically speaking.
While many are trying to guess what the FOMC’s language will be following this week’s probable hike in interest rates. However, my take is that the US Dollar along with US Treasury yields should soon begin to roll back over, and this should happen by the end of July. Thus, any “FedSpeak” that causes both of these to rollover would be my guess as to the takeaway post FOMC.
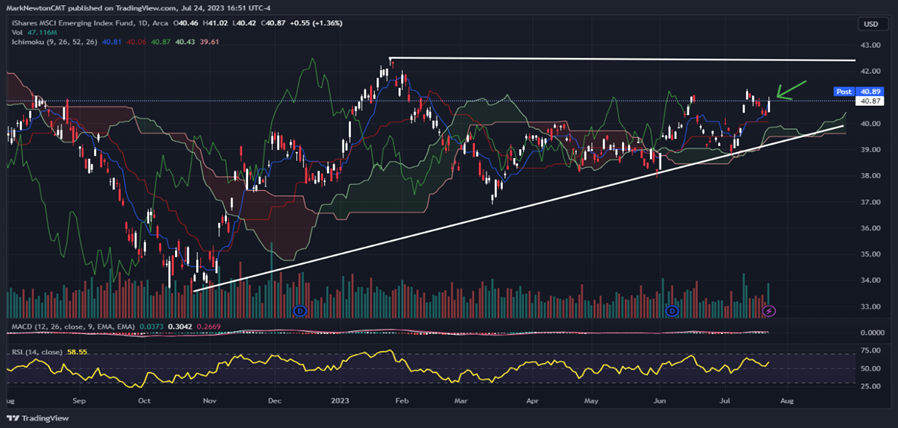
Emerging markets continue to gain more and more traction- EEM looks to rally to $42.50 in the near-term.
Emerging markets have begun a much-needed rally beginning in July and the last few weeks of gains make EEM -0.26% (Ishares MSCI Emerging markets ETF) bullish for a rally to challenge 2023 peaks.
China’s rebound in recent days looks particularly important in this regard given its high percentage within EEM -0.26% , and should be a key reason why this rally can extend in the weeks to come.
While guessing when/if China will start to add stimulus to bolster their economy is not a factor this analysis is based on. Rather, the bullish thesis lies in the price action itself of China’s Large-cap ETF (FXI -0.45% - Ishares) along with China’s Internet ETF (KraneShares -KWEB -1.39% ) (the latter which has pushed to multi-day highs, and would be quite bullish over $30.)
Overall various countries Equity ETF’s have begun to strengthen meaningfully in recent weeks, with Latin America, South Korea, South Africa all showing excellent rebounds. However, given the weighting of China within EEM, this looks particularly interesting and bullish for EEM -0.26% gains at a time when Chinese Equities have begun to strengthen meaningfully.
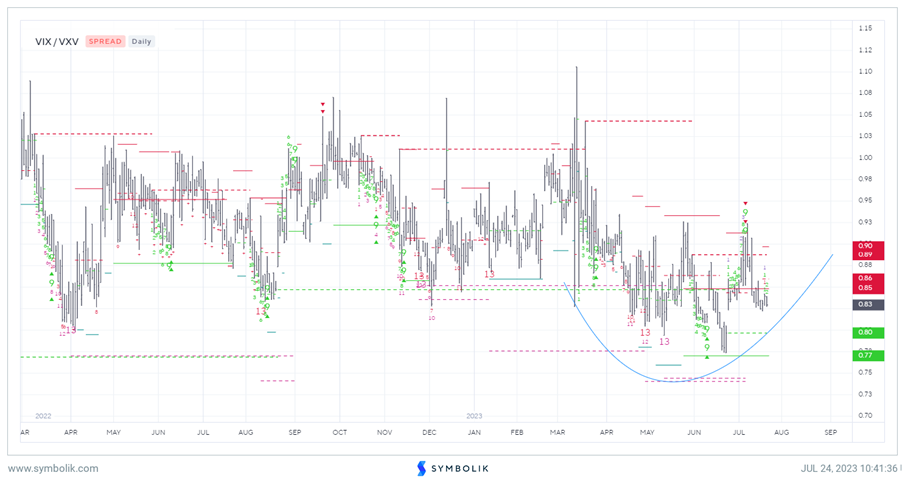
VIX starting to gradually bottom out vs. 3-month VIX
Ratios of VIX to VXV, or comparing Spot VIX to the CBOE 3-month VIX index ((VIX3M) or VXV) shows that the VIX is slowly but surely starting to bottom out vs. the 3-month VIX.
This indicates that the contango in the VIX curve might be close to reversing course, being led by a steep rally in the spot VIX.
Technically, this basing pattern has been ongoing for the last four months. While a bit more weakness this week is possible, this is getting quite close to bottoming out, in my view technically.
Using any market rally between now and end of July to consider adding implied volatility looks appealing in my view, with a timeframe of 4-6 weeks.
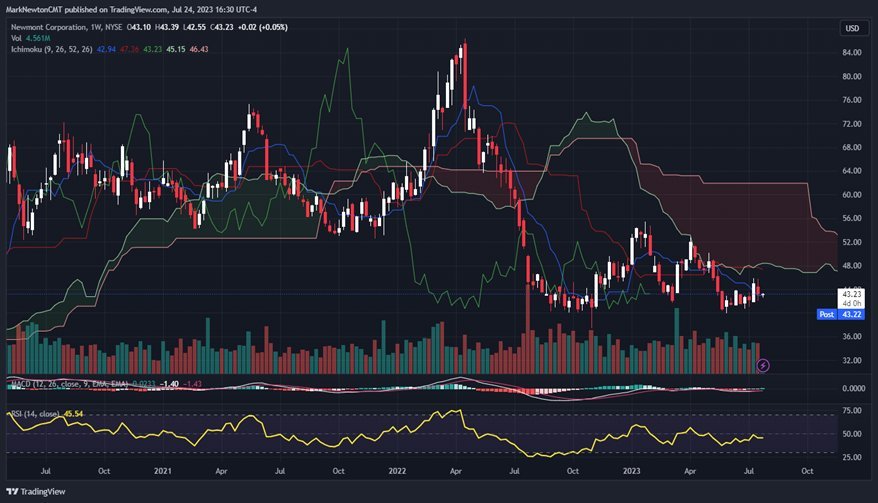
UPTICKS Long– Newmont Mining (NEM 1.08% - $43.23) This report will come out tomorrow, but I’m introducing some new longs and will reintroduce the Laggards as of tomorrow, Tuesday 25th.
I’m introducing NEM 1.08% as a Technical long in my UPTICKS list for both institutional and retail clients. Technically I expect gains to challenge and exceed July highs at $45.92 which should carry the stock up to test 2023 highs just over $55.
Near-term, this consolidation in Newmont hasn’t done much damage, and the stock looks to have found a strong level of support near prior lows from 2022.
US Dollar and Treasury yields are on the verge of turning back lower, which could happen between now and early August. This should allow for precious metals and precious metals stocks like NEM to enjoy a better than average August at a time when the metals likely begin to turn back sharply higher.
NEM’s gains above $55.41 from January 2023 would allow for a push higher to the low $60’s which represents an area of resistance on any gains.
Specifically, $62 looks very important as a 50% retracement of the entire decline from Spring 2022.
Overall, while not shown, monthly charts over the last decade show current levels to be an attractive level of Fibonacci support (61.8%) of the entire run-up from 2015 into 2022. Given that my technical work anticipates an upcoming rally in Gold back to all-time highs, NEM looks particularly attractive as a technical long which has largely languished in recent months.
Importantly, the larger uptrend from 2015 lows connecting Spring 2019 lows intersects right near current levels. This makes NEM an appealing risk/reward, and gains look likely in the weeks and months to come. Only a decline back under $37.45 would serve to postpone an upcoming rally, which looks premature.
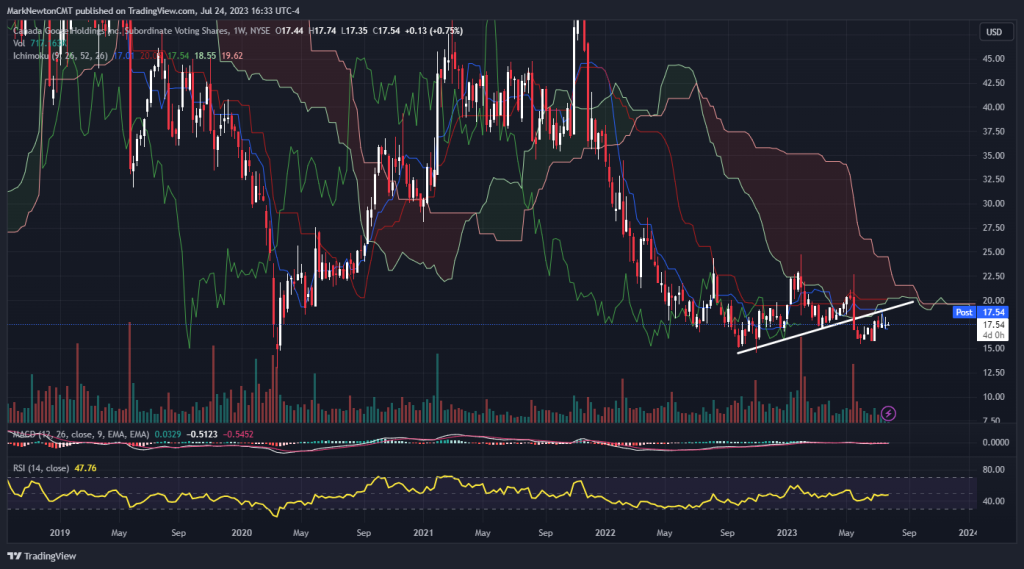
UPTICKS Laggard– Canada Goose Holdings Inc. (GOOS 3.11% - $17.54)
(Note, the Laggards, for those who are new to my technical research, are stocks which I feel have an above-average chance of declining in the weeks and months ahead, specifically based on technical, not fundamental reasons. These are unrelated to Tom Lee’s “Sleeper Granny” stocks, and are stocks that I would avoid technically)
GOOS 3.11% has increasingly started to show evidence of peaking out technically after numerous failed rally attempts in the last few weeks.
This stock remains under the ongoing mild consolidation uptrend that was broken back in May.
An upcoming decline to test and break $17 looks likely in my view which should take GOOS down to challenge and potentially break $15.50.
Any decline under $15.50 makes this vulnerable to a decline to $13.
Only a rally back over $19.50 would serve to help this technical pattern, which is considered strong resistance. If this is exceeded, this would temporarily postpone any decline.
However, over the next 4-6 weeks, it looks probable that GOOS 3.11% should turn lower to challenge monthly lows. This is to be avoided, specifically based on my technical analysis, not for any fundamental reasons.