Trend bullish- S&P 500 closed at the highest levels since last April as the broadening out of the US Stock market rally continues. Expect continued gains into mid-July
June closed with a historic run-up in US Equities, which helped to solve quite a few questions as to the legitimacy of this rally. NASDAQ 100 index closed up +38.75% for the first six months, the best start to a year ever through the first two quarters.
Closing up near the highs of the weekly range keeps trends moving higher with no evidence of any imminent pullback. Momentum has gotten overbought in NASDAQ 100, while certainly not yet there in SPX, nor DJIA or Value Line (the latter looked examined given its equal-weighted nature)
Technology outperformed all other major sectors in trading to close out the 1st half, and Tech has led in performance on a 3-month and 6-month basis. Interestingly enough though, Technology has lagged performance in recent weeks while other sectors like Discretionary and Industrials, not to mention Financials, have shown formidable strength.
Seven sectors closed at one-month highs or greater on an Equal-weighted basis, while Equal-weighted Industrials successfully pushed back to new all-time highs. Meanwhile, Defensive sectors lagged over the last month.
The nature of June’s rally was certainly constructive for market bulls and demonstrated how other parts of the market have come to the rescue of Technology, despite no evidence of Technology peaking out.
Most of my cycle composites show a possible turning point near 7/21, which might also allow DeMark exhaustion to line up on weekly charts. A confluence of the sort “could” be important. However, at present, it’s early to discuss.
SPX as shown below, finished above mid-June highs on an intra-day and closing basis. This should help this rally to continue up above 4500, with 4560-75 being important. Any near-term dips likely would fill today’s gap and likely find strong support near SPX-4400.

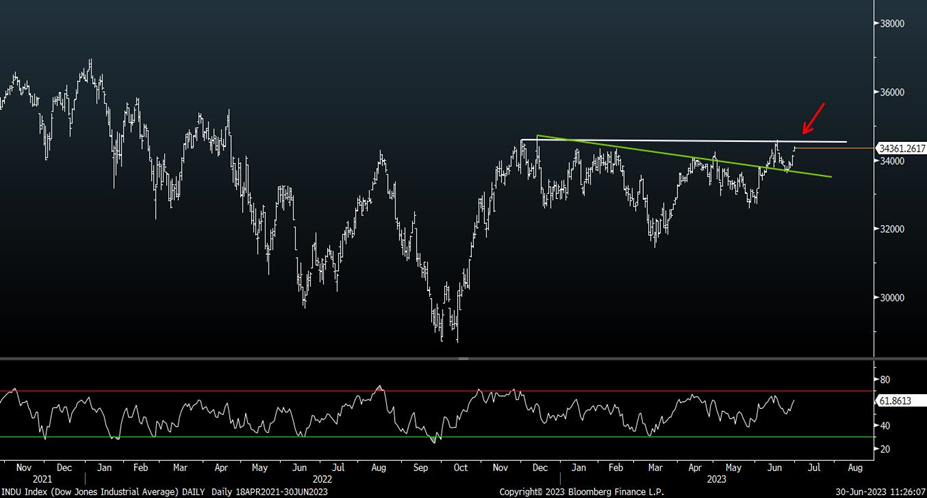
DJIA is getting stronger and nearing its own breakout
DJIA has not yet broken out similar to SPX and NDX. However, its chart pattern is quite constructive as a large base and I expect this does follow suit and breaks out in the weeks to come.
While many complain about the selective nature of this rally, the last couple weeks have thrown that thesis “out the window” Strong performance out of DJIA names like V -0.38% , DOW 0.31% , AXP 1.47% , CAT 4.28% , WMT -0.60% , and HON -0.23% , spread around many different sectors, have all come together and shown stellar outperformance.
Breaking out above mid-June highs at $34588.68 would result in at least a push up to $36000 and would be viewed as quite bullish technically speaking.
Furthermore, equal-weighted gauges like Value Line Arithmetic index, or DJIA are not overbought like some investors are using as a reason not to participate in this stock rally.
DJIA’s Relative Strength index (RSI) shows a reading of 58 on a weekly chart. That’s a far cry from the readings above 70 seen back in Spring 2021, or in early 2020 ahead of the violent snapback.
This pattern is considered to be a reverse Head and Shoulders pattern. Therefore, if this is confirmed on a breakout above mid-June highs, it likely could lead back to challenge All-time highs near $37,000. In the short run, a close above $34,588.68 is what’s necessary to jumpstart technical acceleration higher.
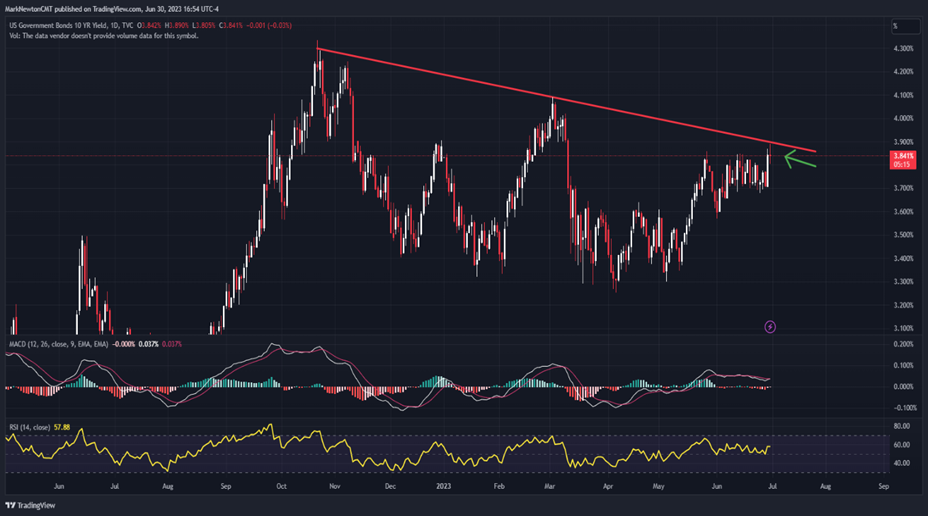
US Treasury yields look close to peaking
US 10-Year yields have pushed higher to right below important technical resistance. ^TNX as a gauge for 10-yr yields likely should not exceed 4.00% before rolling back over.
A reversal back lower looks quite possible as the month of July gets underway, and pulling back to 3.25% certainly cannot be ruled out.
A decline in yields would gel with weekly TNX cycles, and weekly cycle composites show a steady weakening in yields between now and Spring of 2024.
The technical formation in TNX charts, however, does have a bullish intermediate-term look. Therefore, while a near-term drop in yields looks possible, the bigger picture might involve yields rolling over temporarily before bottoming and pushing back higher above 4.00%.
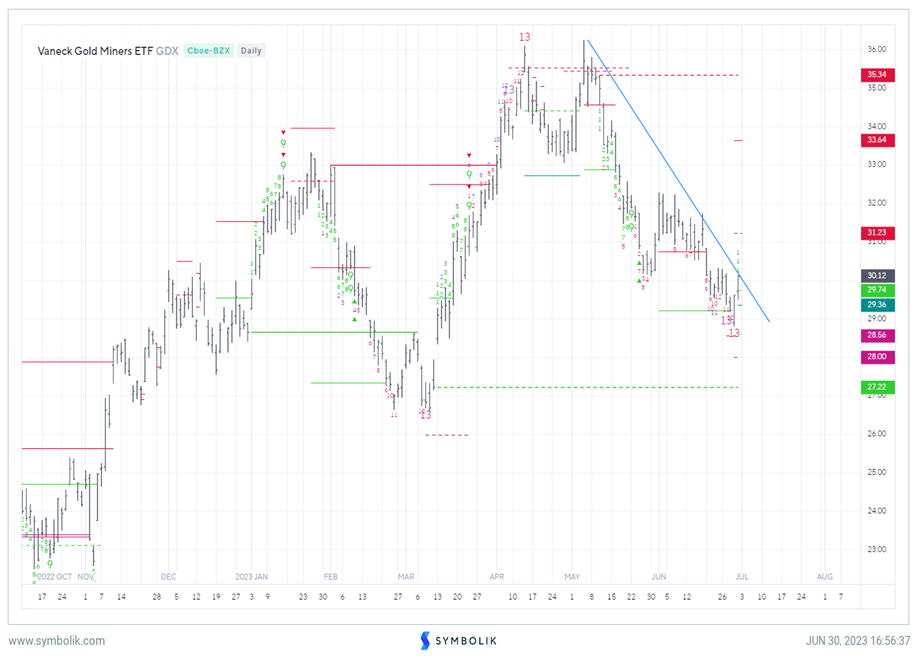
Gold Mining stocks look to be on verge of turning back higher
One interesting counter-trend idea if/when yields start moving back lower involves owning precious metals, which have lagged over the last month.
While my relative charts (shown last week) of Commodities vs. SPX has begun to turn higher, this hasn’t yet been reflected in a meaningful bounce in the precious metals, nor Energy.
Gold and Silver look close to bottoming, but do not have the same technical appeal in the short run as Gold mining stocks. Eventually, both of these should start to work in tandem, pushing back to new all-time high territory.
Daily charts of Vaneck Gold Miners ETF (GDX 3.50% ) shows confirmed TD Sequential 13 countdown signals this week, not dissimilar from what occurred near the bottom in March 2023. Note that peaks in April also coincided with the presence of DeMark exhaustion, but this time as an upside exhaustion indicator (Showing a completed 13 Countdown, or “Sell”)
It’s important to relay that neither Gold, nor silver yet has the similar signal and this might take another couple weeks before these possibly appear. However, the Gold mining stocks might start to lift ahead of the metals outperformance.
Overall, I felt it was necessary to discuss GDX since the gold and silver trade has not yet turned up as planned from when I discussed last month. If/when real rates start to turn over, this should lead to a bigger precious metals rally. At present, despite these not having worked well, I expect both Gold and Silver to turn back sharply higher and test monthly highs.
Bottom line, I still like holding gold mining stocks and GDX at current levels. Over $30.50 would lead to a larger rally up to $33 and that signifies the larger line in the sand before moving back to new highs.