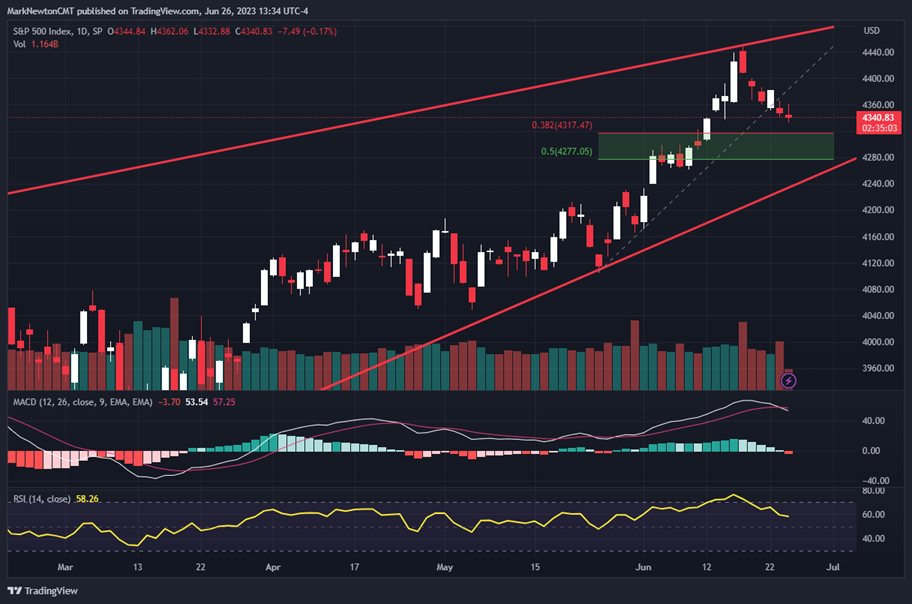
Trend bullish – Minor pullback has not done much damage despite being down 5 of the last 6 days. Meaningful support should materialize between 4275-4320
S&P has now declined 5 of the last 6 days, but has lost merely 2.1% in that timeframe. Meanwhile, the rally from late May which spanned 15 trading sessions managed to successfully gain roughly +7.5% or about +0.5% a day.
Thus, pulling back roughly 1/3 of this most recent rally has not caused much technical damage and still has not violated initial support discussed last week at SPX-4300.
Interestingly enough, despite -0.75% to -1.25% losses in large-cap Sector SPDR ETF’s like XLK 1.11% , XLY 0.20% , and XLC -0.19% , the equal-weighted versions of all these sectors of Technology, Discretionary and Communication Services finished positive on the day.
This goes a long way towards showing how the broader market really turned in far more positive performance than how QQQ 0.89% and SPX’s finish might have indicated, and the Equal-weighted RSP -0.06% was higher by +0.61% on the day.
Factors such as better overall breadth lately, failure of Technology to break down meaningfully (even despite Monday’s weakness in MSFT -1.17% , GOOGL 4.04% ), sentiment being worse than what many in the media are reporting, along with lack of defensive strength all seem like factors which will limit further downside this week.
Overall, I’m expecting a bottom to recent weakness which likely caused SPX and QQQ to find support and start to turn higher this week ahead of the 4th of July holiday. Specifically with regards to the SPX, a daily close back over SPX-4386 should result in a test and breakout back over early June highs which could reach 4500 or higher before a mid-July peak.
The 38.2%-50% zone shown below should prove to be an excellent area to buy dips for a rebound back to highs into and following the Independence day holiday. Stay tuned.
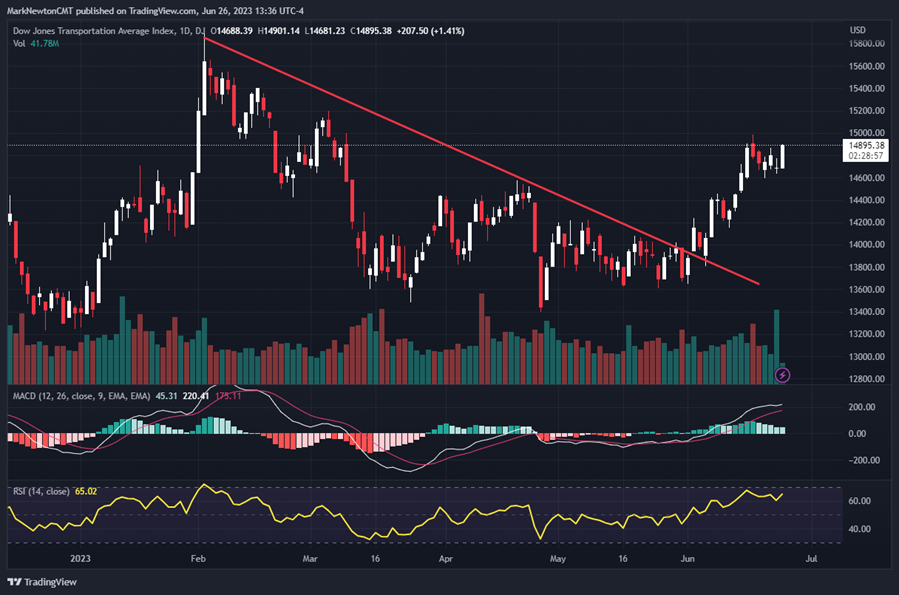
Dow Jones Transportation Average has reached highest levels in over three months
One very helpful development for US equity market bulls is the extent to which the Transports have rallied back sharply in recent days.
While Airlines have outperformed most other areas within the Transportation sector over the last month (4 of the top 5 performers are Airlines in 1 month rolling performance through 6/26/23- DAL -0.33% , JBLU -0.34% , LUV 0.36% , AAL -0.04% ) it’s been stocks like AVIS, ODFL -1.69% , MATX -0.55% , R 0.31% and FDX 0.03% which have all turned in positive performance over the last week, while SPX has moved lower.
All in all, the Transportation rally has begun to broaden out, not unlike the rest of the US Equity market. I expect that DJ Transportation Average (TRAN) should rally back to challenge February peaks at $15888.39 before much resistance takes hold.
The Daily DJ Transportation Average chart below shows the Average having closed at the highest levels since March, which looks quite bullish technically speaking.
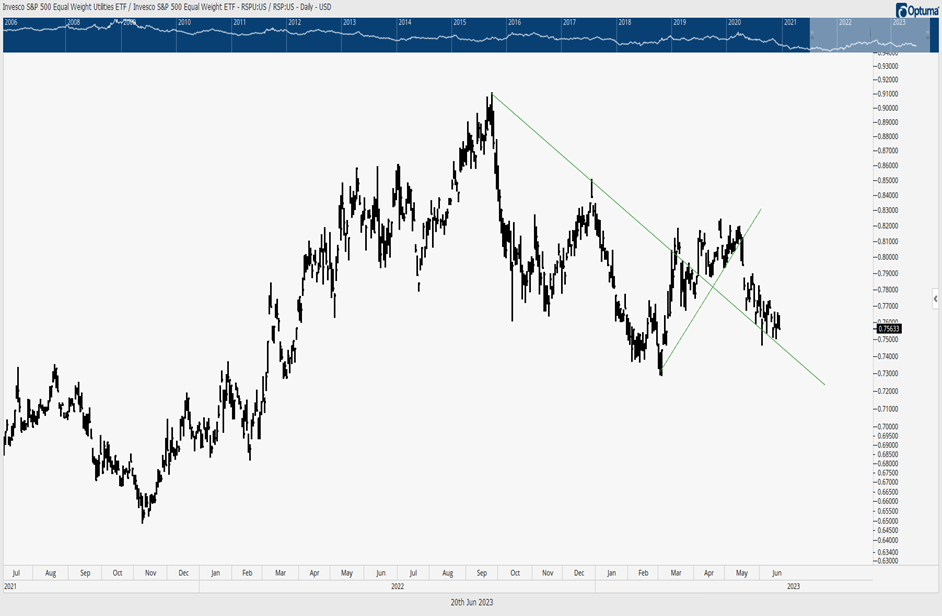
Utilities have weakened sharply during the market rally since late May
One key “tell” that markets might not yet be readying for any major weakness concerns the degree that which many of the Defensive sectors have weakened over the past month.
Many former meaningful market peaks such as early 2020, or late 2021/early 2022 both were preceded by a meaningful era of outperformance out of Staples, Utilities and REITS. While REITS did snapback sharply Monday (6/26), most of the Defensive groups have underperformed meaningfully since late May.
On an Equal-weighted basis (using Invesco’s Equal-weighted Sector ETF’s) four sectors have shown absolute weakness over the last month: Energy, Consumer Staples, Utilities, and REITS. Weakness of this sort normally is quite unusual if Equity markets are readying to top out.
Furthermore, I expect that market peaks likely are not yet in place, and a push back to June highs is likely for US Indices into July. If/when defensive strength starts to pick up in the weeks ahead, it will be worth monitoring, particularly if sentiment also begins to lift more meaningfully. At present, most of the sector rotation still presents quite the bullish picture for Equities in the US.
A ratio chart of Equal-weighted Utilities ETF (RYU -0.90% ) vs RSP -0.06% (Equal-weighted S&P 500) is shown below. This ratio has trended down sharply since mid-May, which doesn’t look indicative of a coming market peak.
Gradual lift in sentiment still not all that bullish
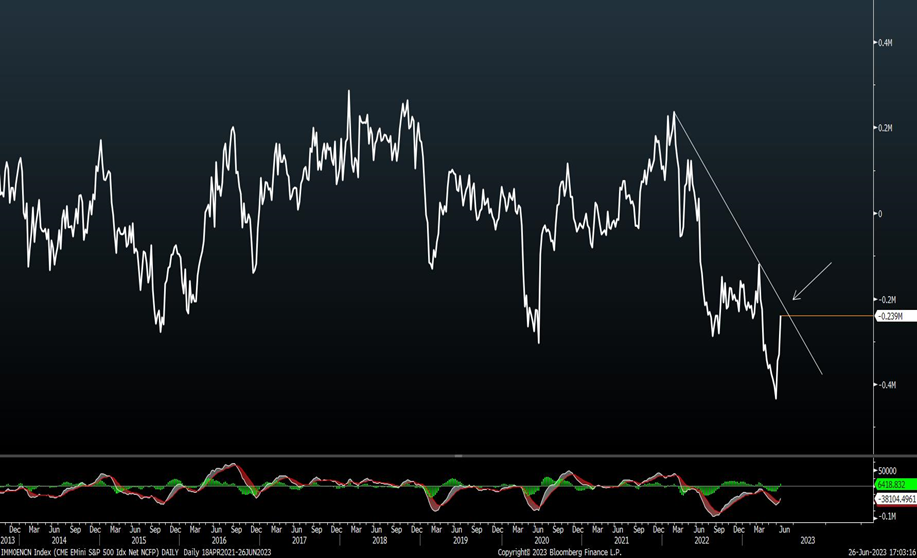
Last week’s Commitments of Traders (COT) report shows a noticeable jump in sentiment, as measured by CME E-Mini S&P net Non-commercial Futures positioning.
Yet, despite the jump, there remains a short position in S&P Futures based on the Non-commercial futures which only brings the Short position back to levels seen in March of this year.
Former peaks in positioning happened back in early 2022 which had reached the highest long positioning since 2018.
Yet, despite the optimistic readings which have cropped up in other sentiment measures like AAII or Fear and Greed, this CFTC data seems more realistic to what many investors and those in the financial media are showing.