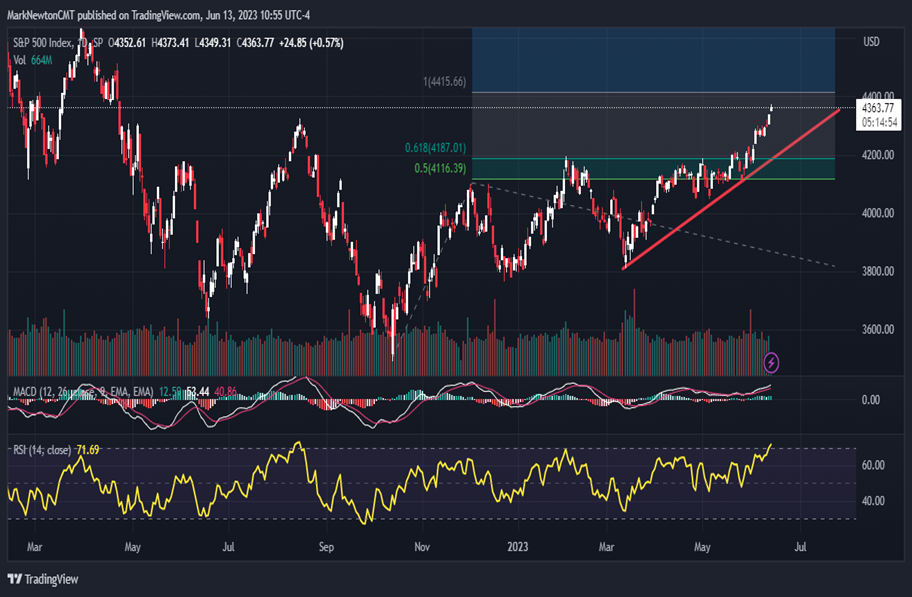
Trend bullish – This 4.5% SPX rally in June hasn’t shown much evidence of tiring. While pullbacks are possible, the trend likely continues up into late June. SPX-4415 important.
I’m traveling for business in LA until late Wednesday evening, so this report and tomorrow’s likely will be abbreviated, but will touch on some of the key points.
US Equities have begun a parabolic run-up to kick off the month of June, with the first nine days having produced gains of over 4.5% through 6/13/23.
No evidence of any exhaustion has occurred, and SPX has exceeded the 61.8% Fibonacci retracement of the decline from January 2022 into October 2022. This is a bullish development and has not yet reached overbought levels on weekly charts (based on RSI readings).
Technology’s minor slowdown in the last week has not led to any decline. Rather, sectors like Industrials, Consumer Discretionary, Financials, and Materials have stepped in to “pick up the slack” These sectors were all up more than 1% on Tuesday (on an Equal-weighted basis).
Sentiment wise, bullishness towards stocks has begun to increase at the retail level; yet, my studies show institutions are still largely defensive and not being quick to change their tune.
SPX cycles show a possible peak by late June, though there doesn’t seem to be much to suggest an intermediate-term peak in early June.
Bottom line, I don’t feel that trying to “time” a perfect top in early June on a rapid comeback in the broader market makes much sense, particularly when DeMark exhaustion and cycles show peaks to be early for US stocks.
SPX likely can rally to 4415 in the short run. This would allow the most recent rally from late May to equal the initial runup from October 2022 into December 2022 in price points gained.
Pullbacks, if/when they occur, likely prove short-lived for now, and I’m skeptical that SPX 4200 is breached right away. This remains the key area of support for SPX to monitor on any pullback.
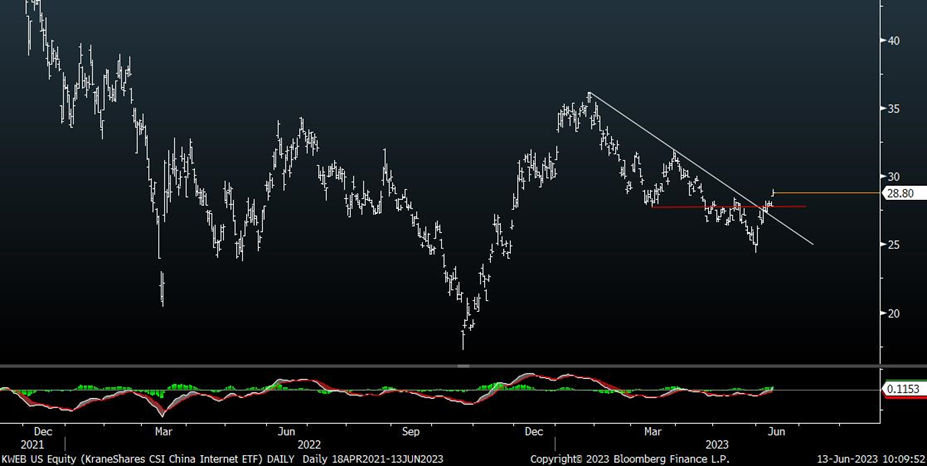
China starting to strengthen to join the Emerging market rally
China’s Large-cap ETF (FXI 1.02% ) has just exceeded the four-month downtrend from February 2023 peaks. This is a bullish development which should lead to rallies back up to $33.38, which is seen as the larger area of importance on the upside.
If/when additional stimulus measures are announced by China, this could very likely kick off a larger intermediate-term rally, which could exceed $33.38 and lead to an advance back to the mid-to-high $40’s.
At present, China’s FXI has become more technically attractive as a result of Tuesday’s breakout, and I expect further gains in the days/weeks to come.
As was discussed last week, the Emerging market rally looks to be underway and might gain steam as a US Dollar decline gets underway.
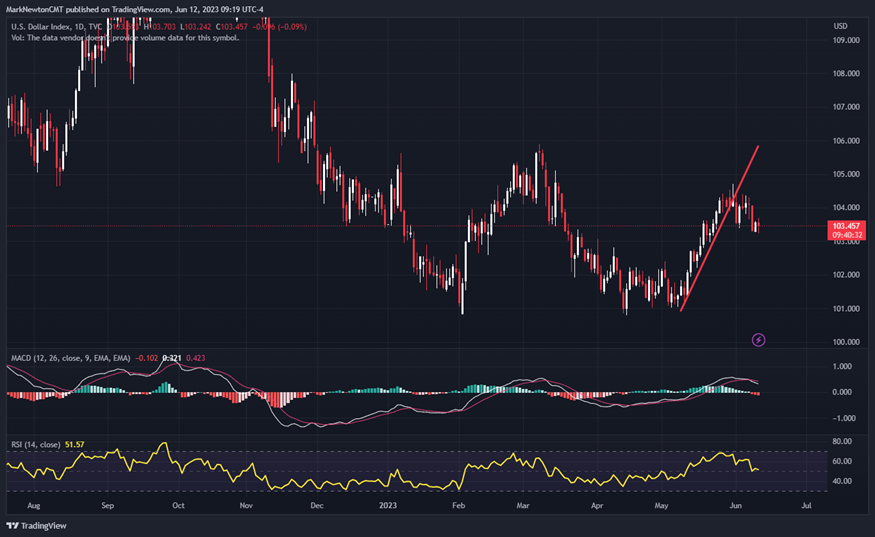
US Dollar index looks to be peaking out
The recent break of early June lows makes it increasingly likely that the US Dollar index (DXY) has begun a technical decline which could lead to lower prices in the weeks ahead.
Momentum has rolled over to bearish using common technical gauges like MACD, and the uptrend from early May was just violated in the last two weeks.
Technically speaking, I’m anticipating a test and break of April/May lows in DXY, which might lead to a tailwind to the Emerging market (EM) trade.
Downside targets for DXY lie in the high $90’s, and I expect gains in Yen, Euro and Pound Sterling in the weeks to come.
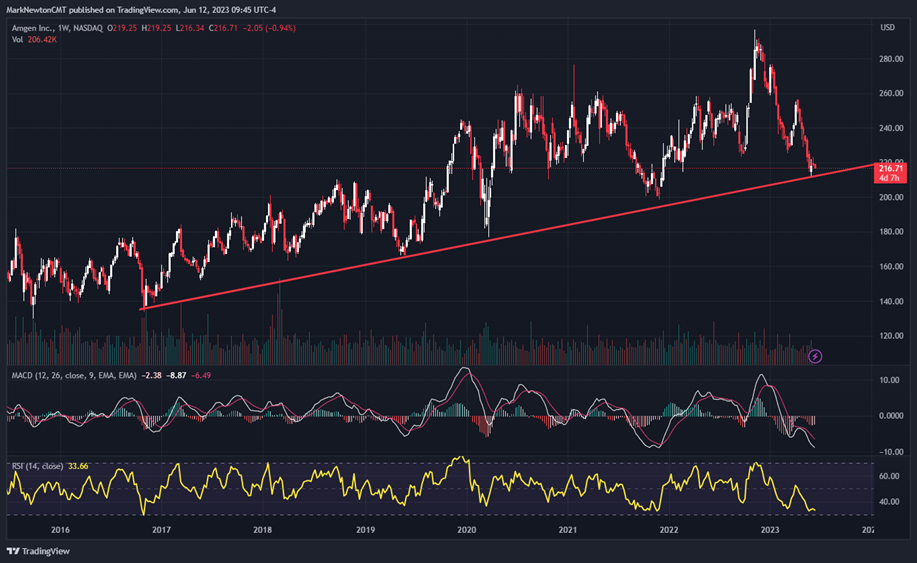
Amgen starting to stabilize near intermediate-term trendline support
AMGN 7.56% has been a disappointment along with many other Biotechs over the last month, but this might be close to changing. Gains back over $223.17 would represent a short-term breakout, which could jumpstart a larger rally in the stock in the weeks to come.
Technically, AMGN 7.56% did violate my support target listed in UPTICKS over the last month. However, I am inclined to view the stock as attractive from a counter-trend perspective given its recent stabilization right near the lengthy intermediate-term trend.
Last week I discussed Biotechnology beginning to mount a technical comeback, which has already begun in many Small cap Biotechs, and to some of the larger Biotech names like Biogen (BIIB 2.65% ).
Overall, I expect AMGN to exceed last week’s highs at $223.17, which should help this rally up to $234, but eventually lead back to April 2023 highs near $256.
The stock has risen now for the last two of three weeks, so barring a break of $211 (which could temporarily lead down to $200) I favor owning AMGN 7.56% technically and expect rallies in this stock coinciding with a seasonal bounce in Healthcare between now and late July.
I’ll lower support to $211 for purposes of the UPTICKS list, and unless this level is breached, I find AMGN technically appealing here to mount a comeback.