
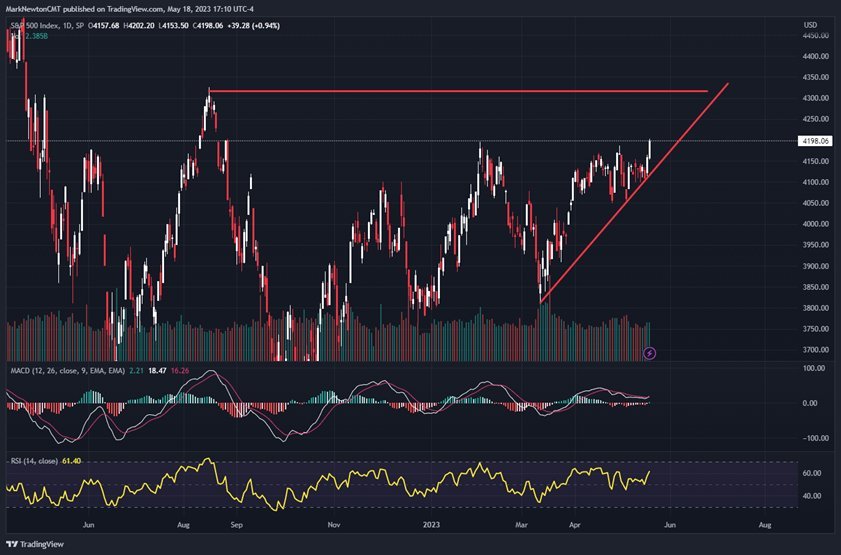
SPX Trend bullish but might encounter resistance at 4235-4250 and maximum lift to 4325 before consolidation sets in.
Wednesday’s breakout wasn’t noticed by many, but set the stage for Thursday’s strong push to new highs for 2023. As noted, several developments happened early in the week that prepared us that the path of least resistance might be higher.
Initially, Technology rebounding was important. Then, Regional Banks bottomed and moved up sharply this week, directly coinciding with DeMark exhaustion. Additionally, Consumer Discretionary broke out vs Consumer Staples. This was important and directly related to both defensive groups like Utilities and Staples turning down sharply, while Homebuilders managed to surge within the Discretionary group.
However, QQQ 0.89% has gotten stretched, and DeMark counter-trend exhaustion is now in place on daily charts. Unfortunately for the bears, weekly charts are extending up sharply this week following last week’s completed weekly TD Sell Setup. While TDST lines are not yet disqualified, this will be something to watch for carefully in the weeks ahead.
An additional minor negative observation concerns the divergence being seen between NASDAQ and DJ Transportation Average and the DJIA. While SPX pushing up to new highs for the year is a definite positive, it’s important for these other benchmark averages to follow suit and make similar movement to confirm this recent strength. This might not be likely right away.
Overall, sector rotation, sentiment and trend analysis are the three factors that most investors should be utilizing for near-term direction, not Fed policy, nor earnings analysis.
At present, Thursday’s push to new 2023 highs coinciding with Debt ceiling deal optimism is certainly a positive for SPX. However, upside is likely limited to 1-2% into June before some consolidation gets underway. I’ll monitor evidence of negative divergences, trendine breaks and/or negative breadth in the days/weeks ahead which might shed some light on the possibility of a turn. For now, further strength into next week still looks likely.
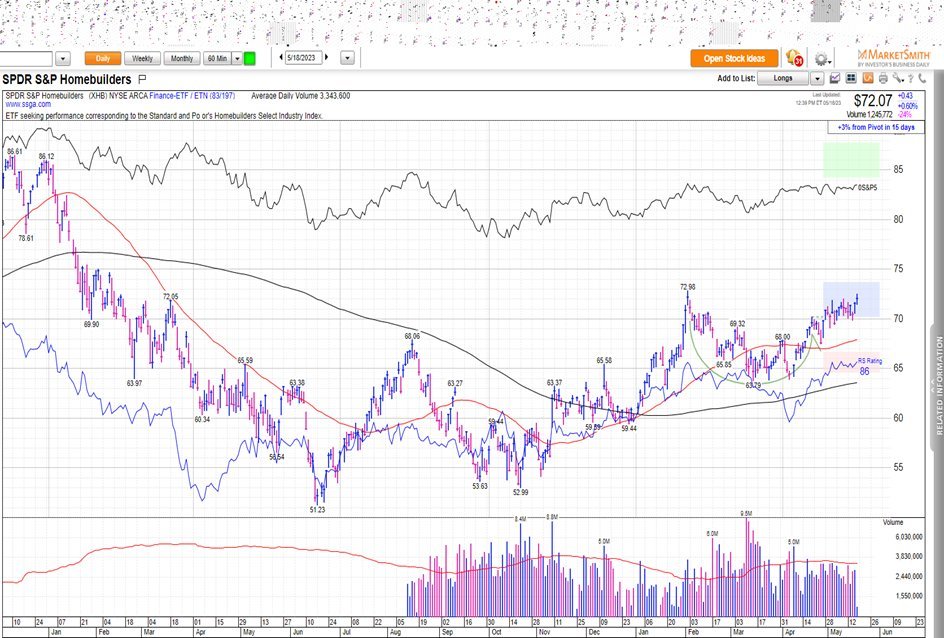
Homebuilders remain technically attractive; Further upside progress likely into June
Homebuilders remain one of the most attractive sub-groups within the Consumer Discretionary sector currently, and XHB -0.01% , the Homebuilders ETF, is set to make a weekly close at the highest levels in 16 months (with a Friday 5/19/23 close above $71.23~ current levels).
This sector has gradually been basing over the last year, but experienced a meaningful lift off last October 2022 lows, and after brief consolidation, has roared back higher to challenge these levels, as seen below.
Despite not having exceeded February 2023 peaks on a daily close, the act of recording the highest weekly close in over year with an absence of DeMark related exhaustion signals should point to higher prices in the weeks ahead.
Technically, I expect a rise back to the mid-to high $70’s initially, which might happen over the next couple months ahead of a necessary correction. At present, both XHB -0.01% and the Home Construction ETF, ITB 0.12% , look quite attractive.
Stocks like BLDR -2.91% , LOW 4.01% , LEN -0.23% , BLD 0.84% , DHI -0.76% , OC 0.90% , PHM 0.15% are my most attractive stocks involved in Homebuilding and construction technically. However, some like BLDR are a bit stretched, and risk/reward opportunities look best in names like DHI and OC which are just pushing to new all-time highs.
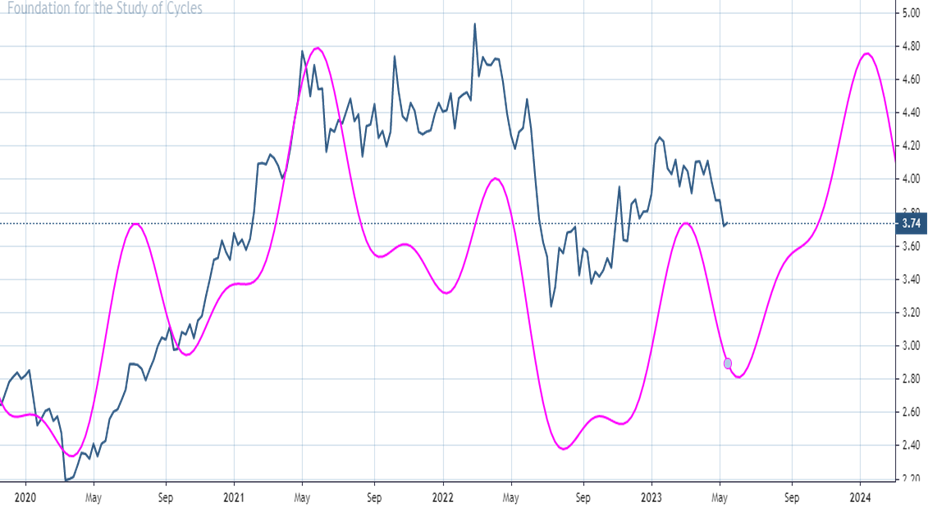
Copper should begin to turn higher by end of May
Copper has neared important support, which I discussed might materialize between 3.50-3.65.
The US Dollar rally has coincided with some near-term weakness in both precious metals and copper lately, and weakening economic data in China might also be thought to be a factor.
Overall, I’m expecting that DXY should be nearing resistance, and should turn back lower in the next few weeks. If this happens, it would fit nicely with Copper’s cycle composite which looks to be bottoming in the next couple weeks.
My weekly cycle composite for Copper shows a late May bottom, followed by a lift back to challenge 2022 peaks, which might happen between June and early 2024.
Overall, prices are near support of the larger uptrend for Copper, while cycles suggest that trends should be able to start to work higher.
Until/unless $3.8220 is exceeded in May 2023 Copper, it will be difficult to have conviction in a low being at hand. However, I expect trends to start to lift in the month of June.
ETF’s like COPX 1.99% , the Global X Copper Miners ETF, or stocks like Freeport McMoran (FCX 2.76% ) look attractive to own for investors with a 6-9 month timeframe or longer.
The next 2-3 weeks should provide some proof as to whether this thesis is correct and Copper can start to move higher. I’ll revisit again when Copper lifts above $3.8220.
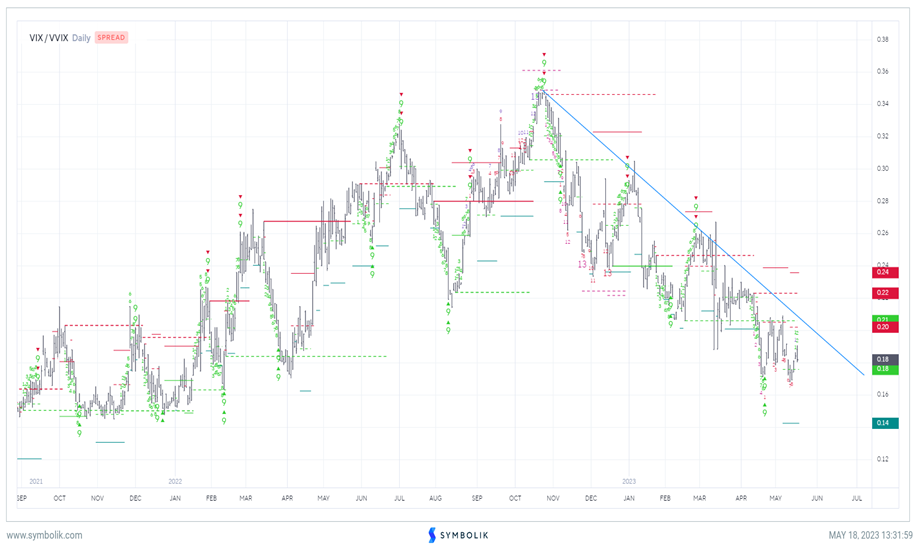
VIX still likely to push lower into late May; “Close, but no cigar”
Many investors remain shocked at the relatively sanguine level of the VIX. As I’ve discussed before, VIX doesn’t rise because of poor economic conditions, or the threat of a recession. Normally only news that’s very negative (or occasionally positive) that catches markets off guard will serve to lift implied volatility.
Technically I use two ratios of the VIX that I find helpful in timing intermediate-term turns. One involves using ratios of the VIX vs the 3-month VIX (VXV) Spot VIX will normally begin to rise in advance of a major market decline, and it’s important when ratios of VIX to VXV start to turn back higher after an extended decline.
Another ratio I find useful (shown below) is the ratio of the VIX to the VVIX (VIX of the VIX- A second derivative measure which measures the change of volatility of the VIX itself. (VVIX measures how rapidly volatility changes)
Former market peaks normally coincide with the VIX starting to show greater strength than the VVIX, exceeding downtrends and starting to turn higher.
At current levels, no evidence of downside exhaustion (Per DeMark indicator TD 13 Sequential signals on Symbolik) are present at current levels on daily charts.
The key takeaway is that additional near-term weakness is possible in the VIX over the next couple weeks ahead of implied volatility likely starting to bottom out in June. At present, my technical projections show a possible decline down to $14.50-$15.50. If this level is reached into late May and/or June, it should be attractive to consider implied volatility on a 3-6 month basis for hedging or speculation purposes.