


Stocks fell sharply on Thursday, with S&P 500 falling ~2% ahead of the important Feb jobs report released today (3/10) at 8:30am ET. Equities have been soft all week, but the weakness on Thursday arguably stems from two factors (not in any order):
- First, the concerns of a “hot” Feb jobs report above the Street consensus of +225k and +0.3% AHE (avg hourly earnings MoM). Whispers are stronger and even Linkup forecasts as much as +365k. This heightens concern the Fed needs to re-accelerate the pace of hikes to +50bp from +25bp, a hawkish development.
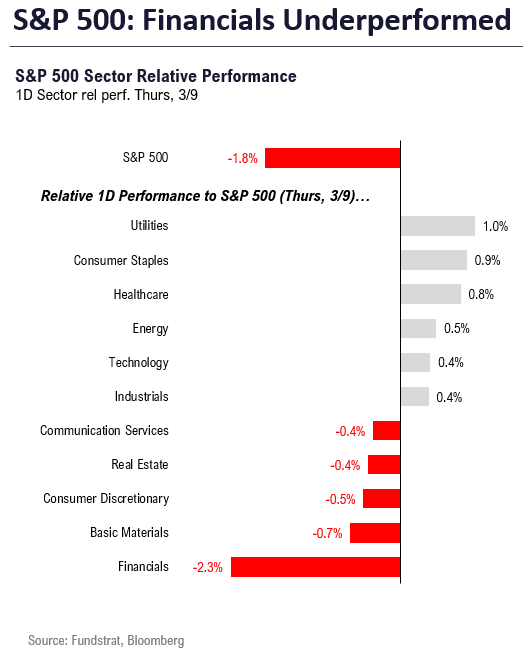
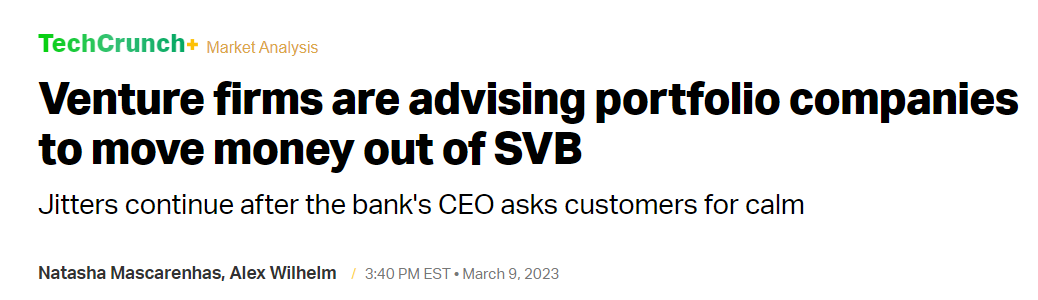
- Arguably this second factor is more important, the capital raise by Silicon Valley Bank (SIVB) triggered massive second order ripple effects causing S&P 500 Financials to fall 4%. The raise was to restore capital levels as losses from securities portfolios (higher rates) plus early stage companies using cash (but raising little), ate into the company’s capital cushion. SIVB, the 16th largest bank in the US, is one of Tech industry’s largest lenders and media stories suggest VC and PE firms might be advising founders to move cash away from SIVB — essentially fueling a panic among Financials.
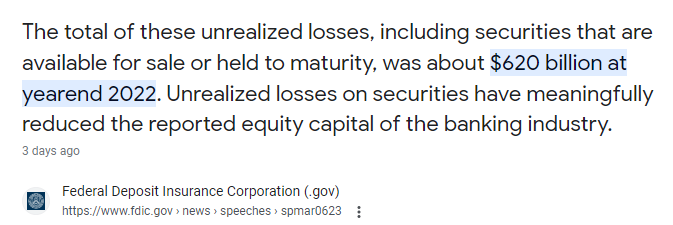
- The SIVB capital shortfall highlights the fact that banks collectively are sitting on sizable losses on loans due to the rise in interest rates. The FDIC reported that at the end of 2022, the total unrealized losses is $620 billion (vs ~$15b 2021), and if these banks had to liquidate their portfolios, would substantial deteriorate book value.
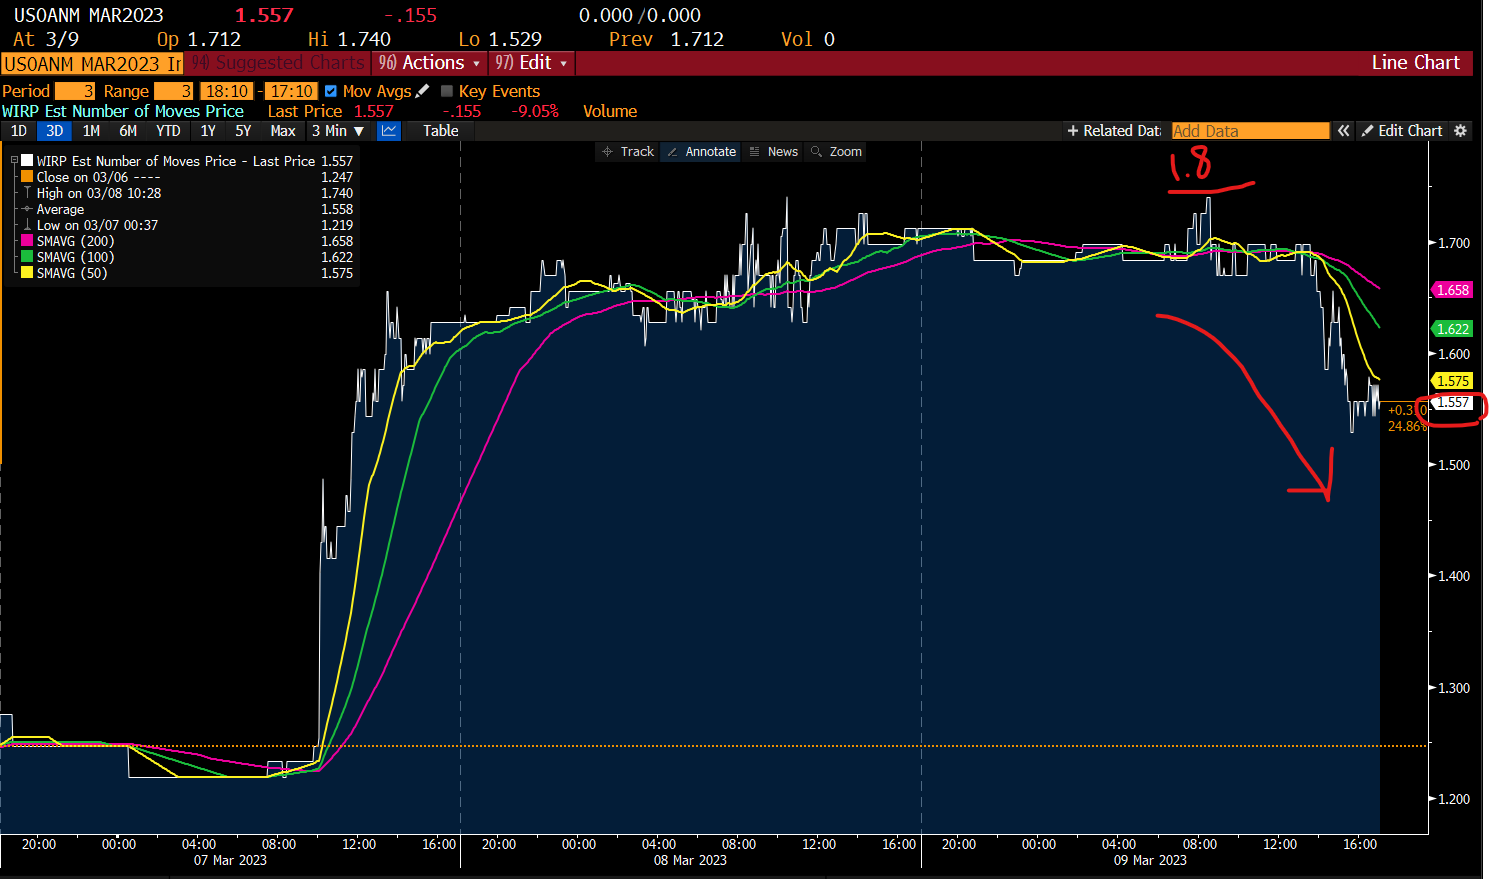
- This second reason is why March hike probabilities actually fell today to 1.557 hikes versus 1.8 hikes prior to SIVB. Basically, restricted lending by banks amplifies the impact of Fed hikes in place now, and would reduce the need for future hikes.
- Hence, while the NFP jobs report will be very important for the Fed, the SIVB-induced bank scare actually offsets the inflationary risks for the Fed to an extent.
- That is, even if Feb jobs is really strong, the continued second order effects of the SIVB-issues will contribute to a tightening of financial conditions. Meaning, the odds of the Fed having to accelerate its pace of hikes might be reduced.
- In other words, bond yields might not react the way the Street expects on Friday. Intuitively, one would expect a “hot” jobs to push up yields (2Y and 10Y) and raise odds of a +50bp hike for March and May. This may indeed happen.
- But with investors and depositors rattled by the troubles at SIVB, financial conditions are tightening. This potentially reverses some of the hawkishness one would expect from the Fed.
Overall, this has been a tough week and the turmoil in equity markets reflect this. But we remain in the view that equities are entering a positive 8 week period and expect stocks to end higher by the end of April.
Post-SIVB, March hike expectations actually fell
As shown below, the expectation for March is now 1.55 hikes versus 1.8 hikes prior to the SIVB hit. And this reverses some of the hawkish move generated by Powell’s comments on Tuesday to the Senate.
Financials took it in the gut yesterday
Part of this is attributable to actions taken by depositors of SIVB. Venture firms are advising their portfolio companies to move money away from SIVB. This is actually a surprise move, given the many ways SIVB can access capital and the limited risk of a full blown inability to repay depositors.
- but this is a sign of the times as markets are on the “fire, ready, aim” mode
And SIVB is a reminder that banks are sitting collectively on large losses due to the rise in interest rates.
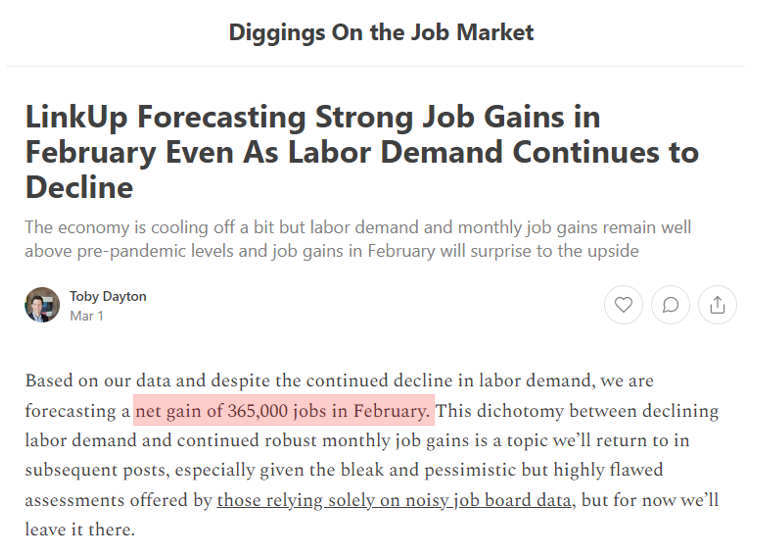
FEB JOBS: Linkup Expecting a hot jobs report
LinkUp has been a good source of alternative job data research. And their researchers expect a stronger than consensus jobs gain of +365k. This reflects their working showing the jobs market remains tight, even as it has come off the boil.
CALENDAR: Key incoming data starting March 10
There is lot of incoming economic data this week (durable goods, housing, unit labor costs and ISM) but for the key inflation-related data, there is a bit of a dead spot until early March. As shown below, this really starts March 10th:
3/7 10 am ET Powell testifies SenateHawish3/8 10am ET Powell testifies HouseNeutral3/8 10am ET JOLTS Job Openings (Jan)Semi-strong3/8 2pm ET Fed releases Beige BookSoft- 3/10 8:30am ET Feb employment report
- 3/13 Feb NY Fed survey inflation exp.
- 3/14 6am ET NFIB Feb small biz survey
- 3/14 8:30am ET CPI Feb
- 3/15 8:30am ET PPI Feb
- 3/17 10am ET U. Mich. March prelim 1-yr inflation
- 3/22 2pm ET March FOMC rate decision
- 3/31 8:30am ET PCE Feb
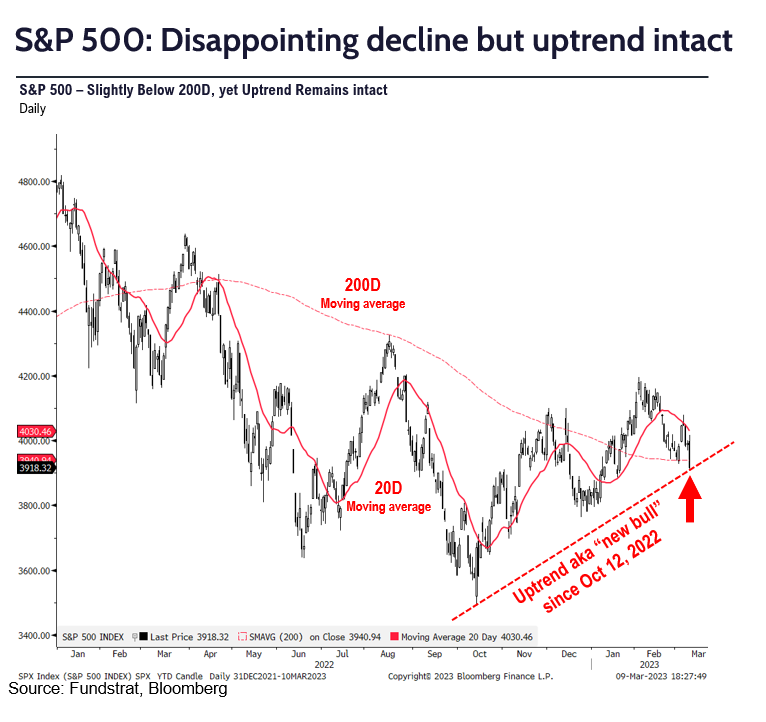
STRATEGY: Stock uptrend remains intact despite recent sell-off in equities
Despite the recent sell-off in equities, the uptrend remains intact. While those bearish view stocks as in a downtrend:
- the chart below shows the uptrend still intact
- Admittedly, it has been a tough week
- We remain constructive on the market and expect stocks to end higher by the end of April
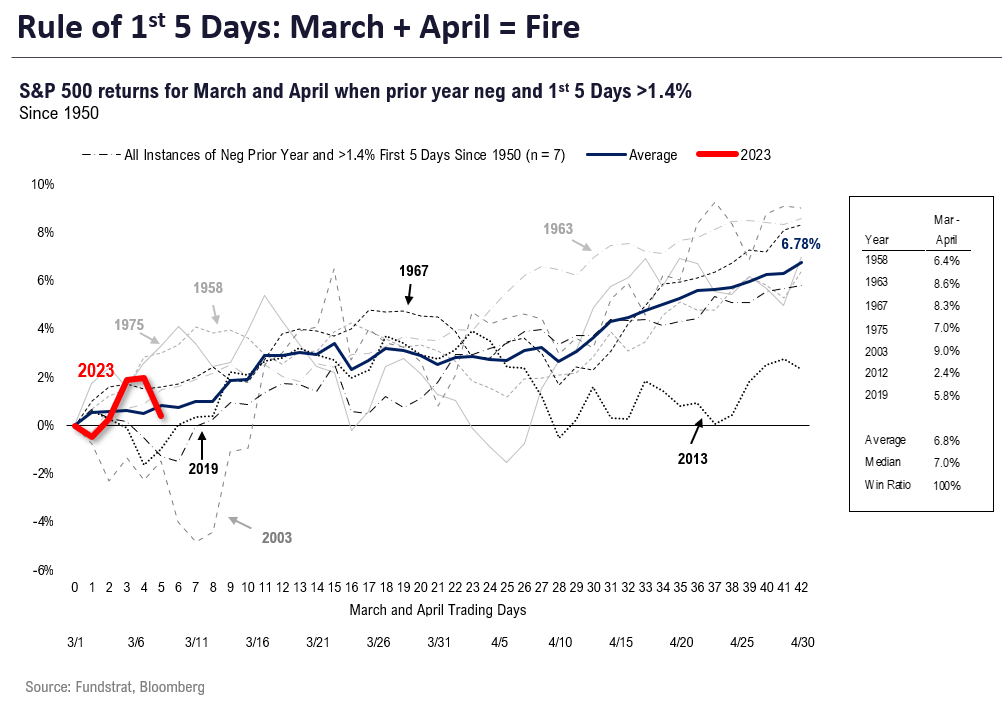
But the calendar remains supportive. Below is:
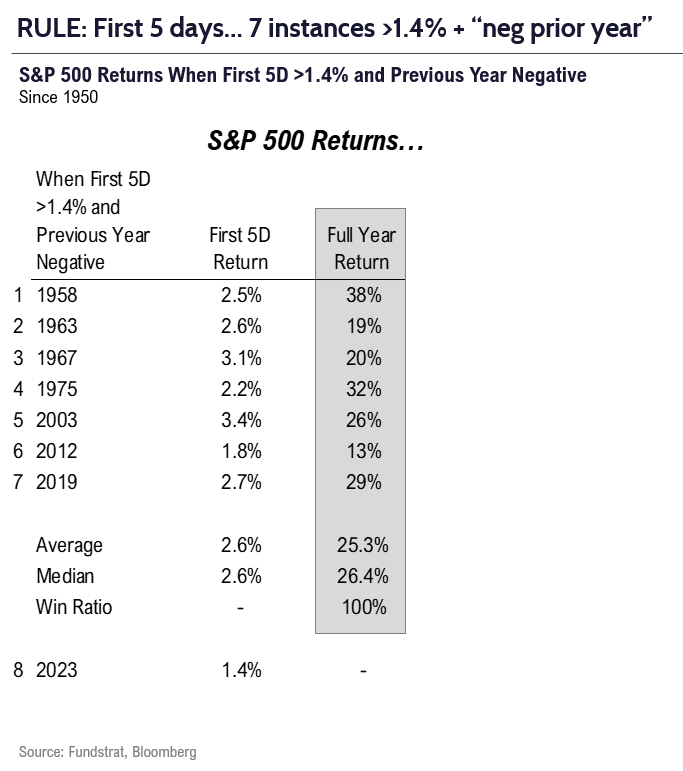
- the composite for the 7 precedent years when stocks >+1.4% and negative prior year
- 7 of 7 times the 8 weeks March to April positive
- Median gain is +7%
- This implies 4,250 or so on S&P 500
RALLY: 6 reasons we see a rally next 8 weeks
Here are the reason we see equities gaining in the next 8 weeks:
- The last of the “hot” inflation data was the 4Q ULC (unit labor cost) at +3.2% and beginning next week, will be incoming February economic and inflation data, which we believe will show “softer” jobs and “softer” inflationary pressures. This will reverse, to an extent, the somewhat alarming surge in inflation and jobs data of Jan (part seasonal, part noisy data).
- Fed chair Powell actually kicks off this period with his semi-annual testimony to the Senate Banking Committee and House Financial Services Committee and we expect Powell to reinforce the “data dependent” message. Meaning, +25bp is the path for March FOMC, barring evidence of continued acceleration of inflation. Fed’s Bostic said the same essentially Wednesday in his speech.
- The bond market will likely pivot dovish in March. The “hot” Jan inflation data caused the bond market to price in higher odds of +50bp in March and April, and Fed speak seems to be pushing back against that — meaning, Fed is less hawkish than recent move in bonds.
- Falling VIX. If the incoming data tilts the way we expect (“softer”), then bond volatility should fall, which supports a stock rally in March to April. This means VIX could fall, and a falling VIX is supportive of higher equity prices.
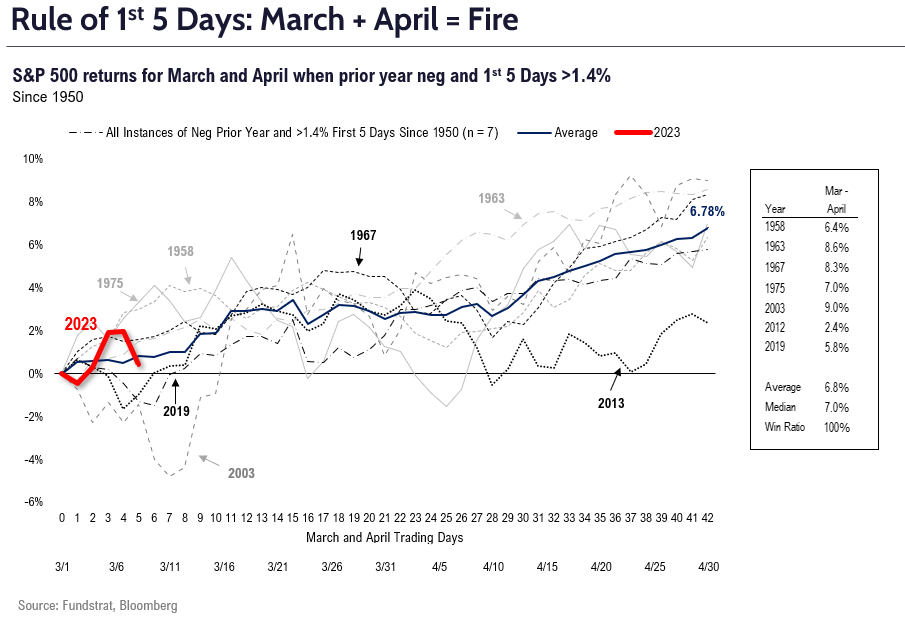
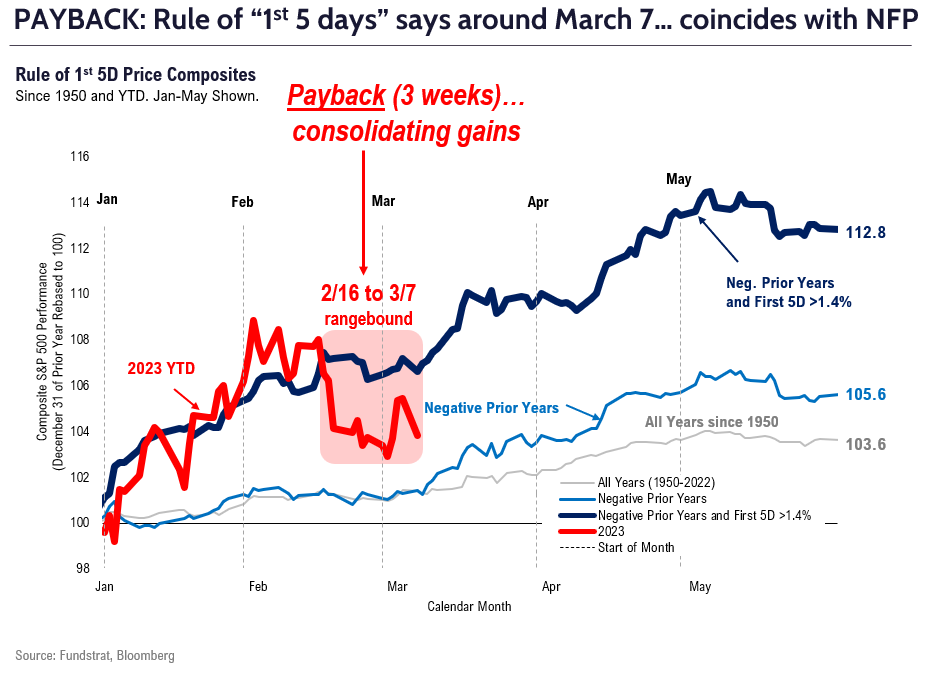
- Seasonals are also a strong argument. We have been using the composite of “rule of 1st 5 days” using the 7 precedent years where gains >1.4% in the first 5 days (ala 2023). This composite implied market gains into Feb 16 and a consolidation thru early March (3/7). 2023 is following this pretty closely.
- This same composite now implies March to end of April will be the strongest 8 week period for 2023 with a median gain implied of 7%. If 2023 follows this path, the S&P 500 could reach 4,250-ish by the end of April. By the way, this lines up with the ~4,300 level in the coming weeks.
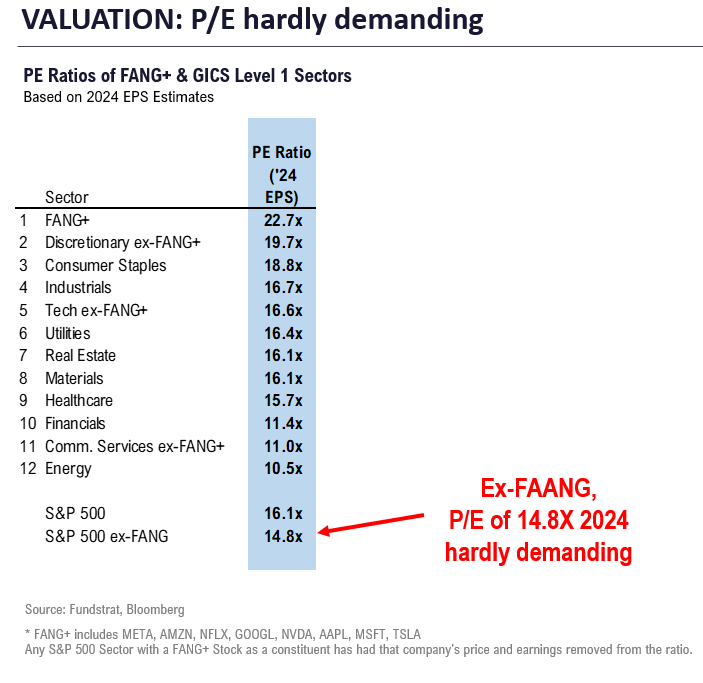
- I am not sure I agree with those who say the stock market is expensive. I think many cite this as another “confirmation bias” to stay on the sidelines.
- As highlighted earlier this week, ex-FAANG, the P/E (2024) of S&P 500 is 14.8X. And sectors like Energy are 10X and Financials 11X. These are not demanding valuations. And consider the fact that the US 10-yr at 4.0% yield is an implied P/E of a bond of 25X. Yup. The bond market is still far pricier than stocks.
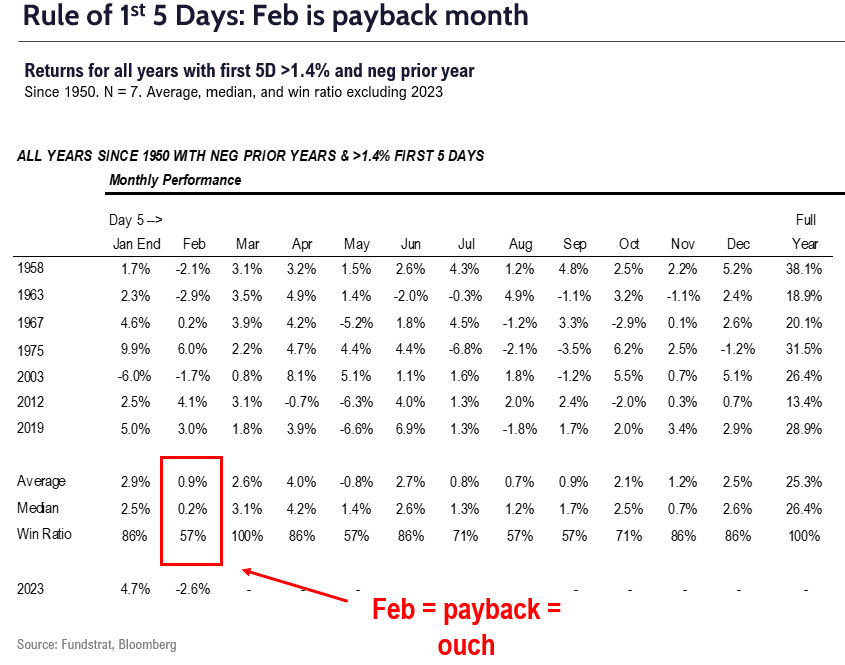
PAYBACK (aka Calendar): Feb = payback, March+April = Fire
As you know, we are using the composite of the “rule of 1st 5 days” as the template for 2023 — this is a calendar template. The other is the breakaway momentum (see note Monday). And as we flagged earlier this year, Feb is a “payback” month:
- of the 7 precedent instances, Feb is up only 57% of the time, which is worst of any calendar month
- median gain of +0.2% is the worst of any month
- hence, Feb is not a month that investors can arguably see gains
- Feb 2023 sort of validates this template still valid
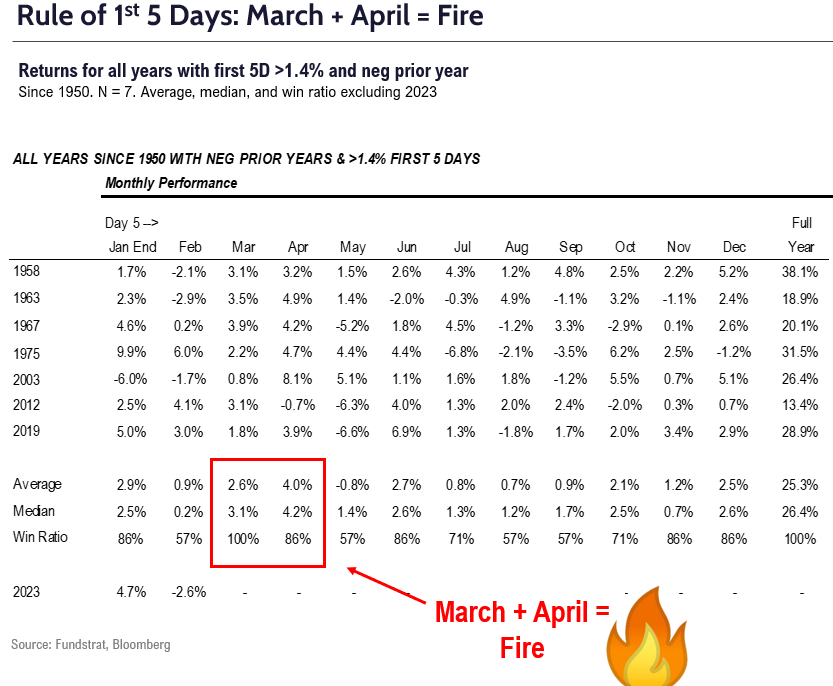
Next 8 weeks is “buy the dip”
But this same template says March + April should be very good months for stocks:
- win-rate is 100% or 7 of 7 times March is a gain
- Median gain of March and April are the strongest
- Even stronger than January
- Hence, we think the next 8 weeks is a period of “buy the dip”
For those tactically focused, this composite below shows March 7 is the ideal window:
- this coincides with Mark Newton, Head of Technical Strategy, who sees markets chopping here near term
- but this softness is a buy the dip moment, as the next 8 weeks should be among the strongest
VALUATION: Ex-FAANG, S&P 500 P/E is 14.8X, hardly demanding
We hear investors say the market is too expensive. But this is distorted by the higher multiples of FAANG, and we think the higher multiples of FAANG are justified.
- ex-FAANG, P/E is 14.8X
- this is hardly demanding
- Energy is 10.5X, whoa
- so, still think the equity market is expensive?
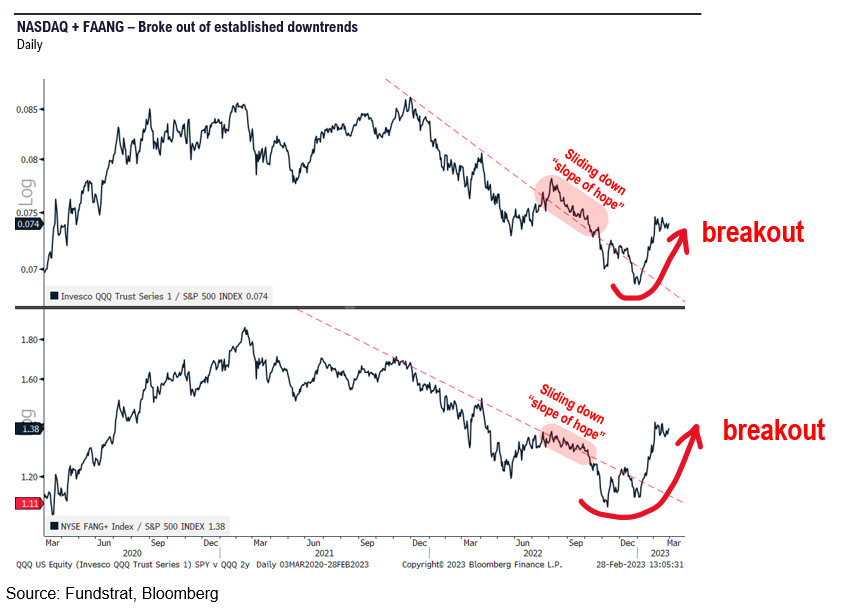
TECHNOLOGY: Still our favorite Sector pick for 2023
As we noted in our 2023 outlook, Technology is our top sector pick, which we expect to be led by FAANG.
- Technology and FAANG are now established meaningful breakouts as shown below
- this after sliding down the slope of hope in much of 2022
- this reversal has fundamental arguments
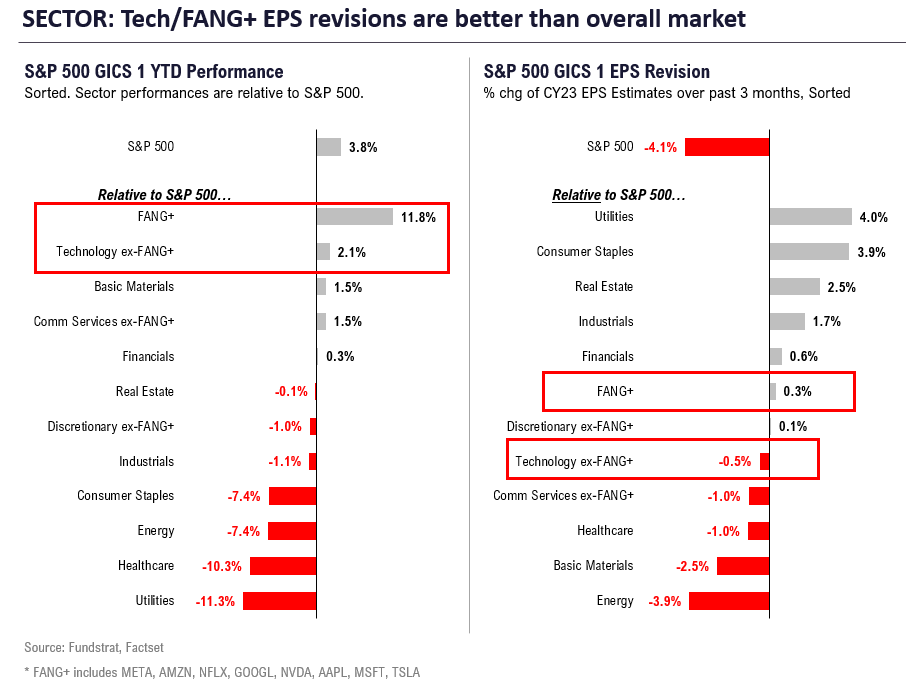
TECH EPS: Bottoming before the overall market
The two best performing sectors YTD (as of end of Feb) are:
- FAANG +1,180bp outperformance (vs S&P 500)
- Technology +210bp
- Defensives have been terrible, despite those arguing for a recession
- Tech/FAANG EPS has been slightly better than the overall market
- Thus, leadership is coming from groups with EPS bottoming
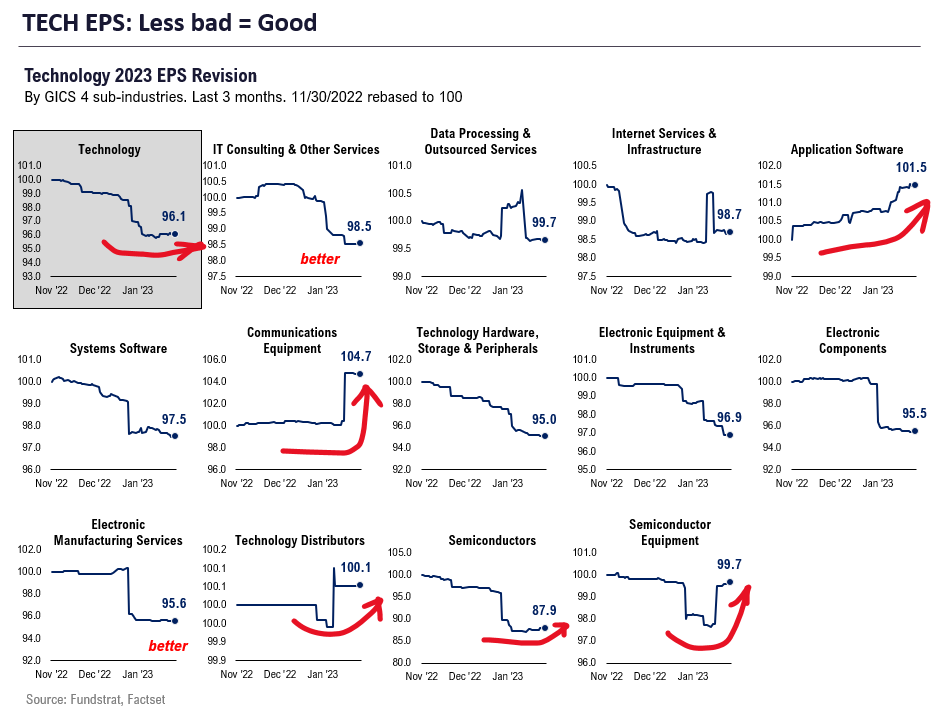
7 of 14 sub-groups in Technology seeing upward bias in EPS revisions
Take a look at 2023 EPS in the 14 sub-groups (GICS 4) of Technology.
- Half, or 7 of 14 are seeing upward bias in 2023 EPS revisions
- So, those saying Technology is a “sell” are overlooking that EPS momentum is turning positive
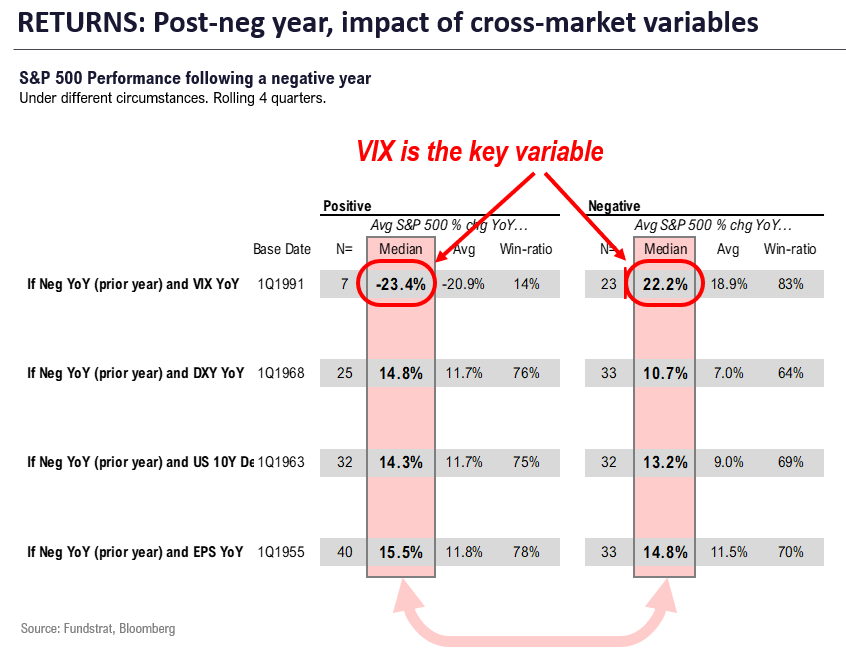
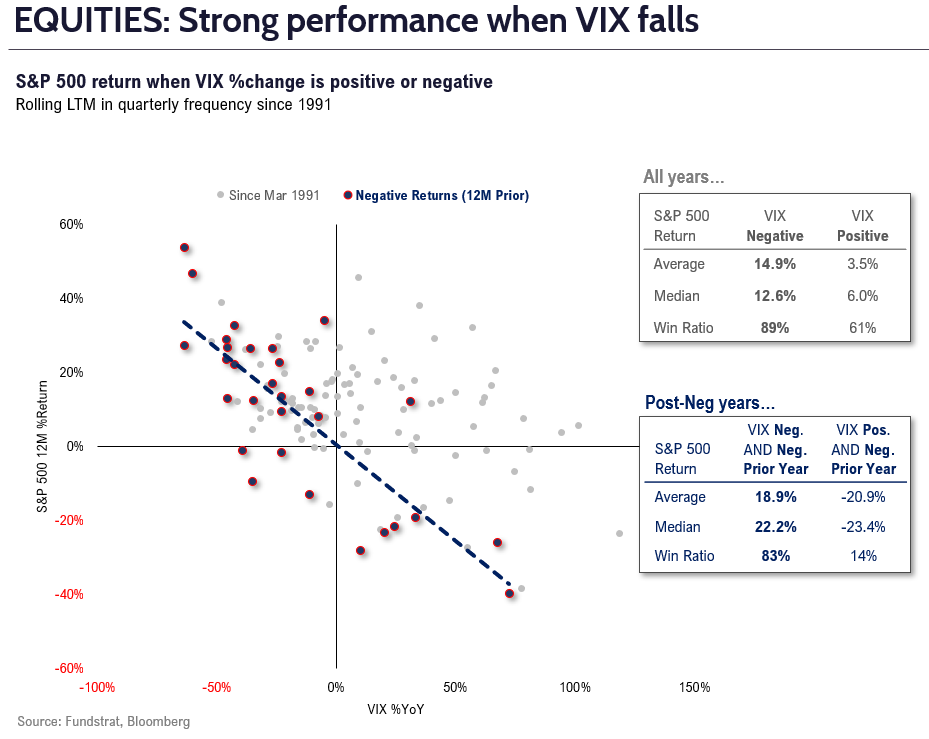
STRATEGY: VIX matters far more for 2023 returns than EPS growth
Our data science team compiled the impact on 2023 equity returns from variables:
- S&P 500 post-negative year (2022)
- the varying impacts of
- VIX or volatility
- USD change
- Interest rates
- EPS growth
- All of the 4 above, positive or negative YoY
- Data is based on rolling quarters and summarized below
The surprising math and conclusions are as follows:
- most impactful is VIX
- Post-negative year (rolling LTM)
- if VIX falls, equity gain is 22% (win ratio 83%, n=23)
- if VIX rises, equity lose -23% (win ratio 14%, n=7)
- I mean, this shows this all comes down to the VIX
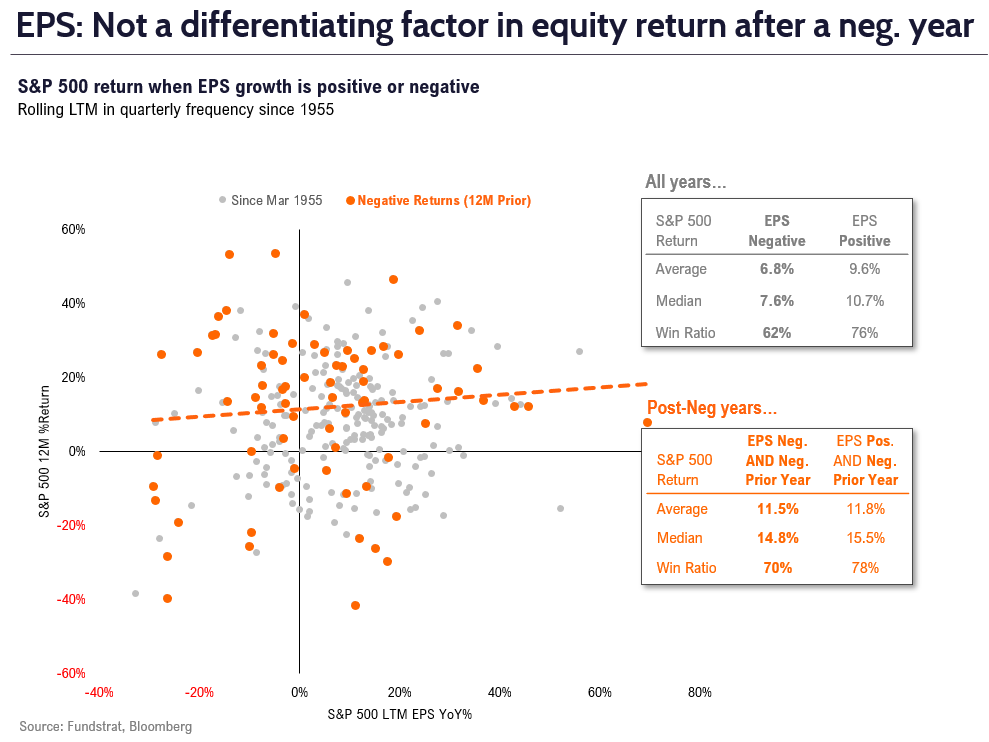
- EPS growth has little impact
- If EPS growth is negative YoY (likely), median gain +14.8% (win-ratio 70% n=33)
- If EPS growth is positive YoY, median gain is 15.5% (win-ratio is 78%)
- Hardly a sizable bifurcation
As the scatter below highlights, we can see the sizable influence of the VIX. Even in all years, the VIX is a key factor:
- in our view, if inflation falls sharply
- and wage growth slows
- Fed doesn’t have to cut, but this is a dovish development
- we see VIX falling to sub-20
- hence, >20% upside for stocks
And as shown below, EPS growth has a somewhat important correlation, but hardly as strong as VIX changes.
- the difference in median gain is a mere 70bp (positive vs negative) post-negative year
- the importance of EPS growth is stronger in other years
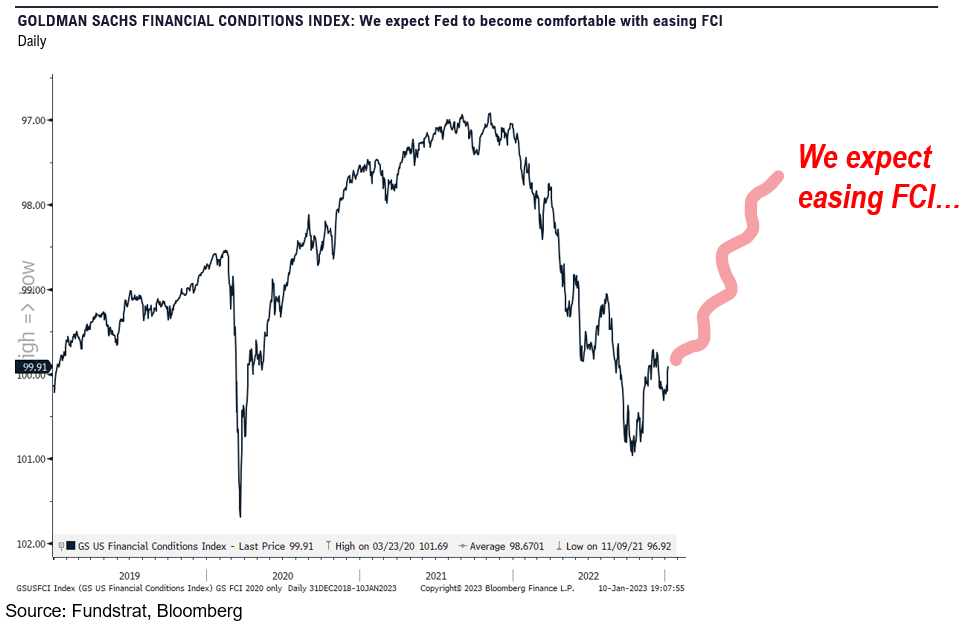
STRATEGY: Financial conditions should ease in 2023, driving higher equity prices. Technology, Discretionary and Industrials levered to easing FCI
The “base” case for 2023 should be below. That stocks gained >1.4% in the first 5 trading days, and this portends strong gains for the full year:
- Post-neg year + up >1.4% on first 5 days
- Day 5 to first half median gain is 9.5%
- Full year median gain is 26%, implies >4,800 S&P 500
- 7 of 7 years saw gains.
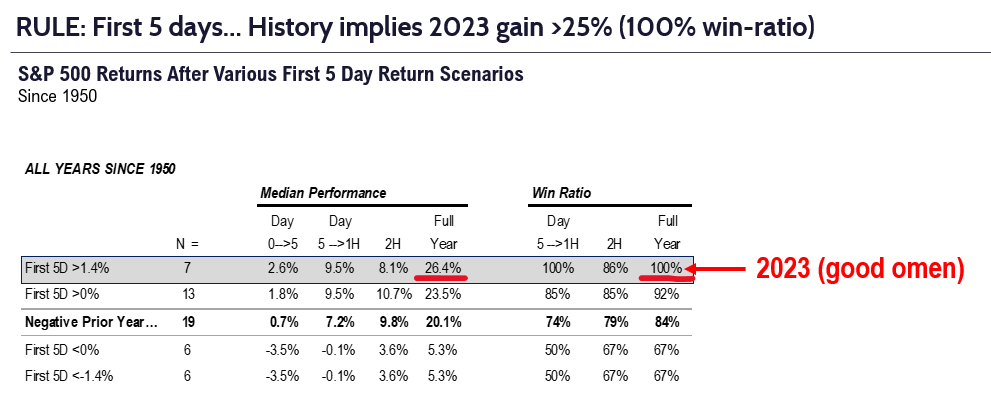
Those 7 precedent years are shown below.
- the range of full year gains is +13% to +38%
- so, this is a VERY STRONG signal
- the two most recent are 2012 and 2019
- we think 2023 will track >20%
The path to higher equity prices is discussed above:
- core inflation falling faster than Fed and consensus expects
- wage inflation is already approaching 3.5% target of Fed (aggregate payrolls)
- Fed could “dovishly” leg down its inflation view
- allowing financial conditions to ease
- bond market has already seen this and is well below Fed on terminal rate
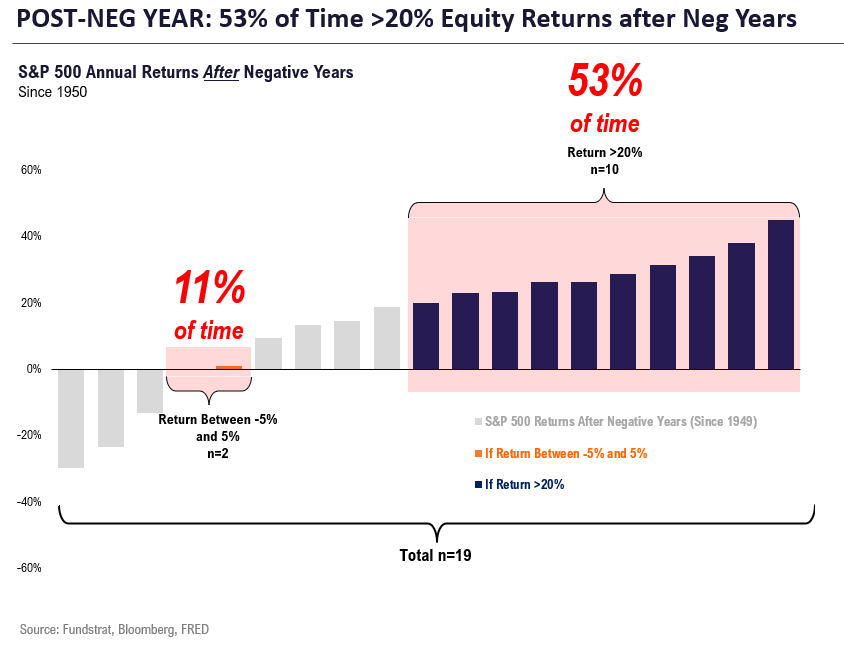
BASE CASE: The “maths” for what to expect in 2023, post a “negative return” year (2022)
Question: how common is a “flat” year? Our team calculated the data and it is shown below:
- since 1950, there are 19 instances of a negative S&P 500 return year. In the following year,
- stocks are “flat” (+/- 5%) only 11% of the time (n=2)
- stocks are up >20% 53% of the time (n=10)
- yup, stocks are 5X more likely to rise 20% than be flat
- and more than half of the instances are >20% gains
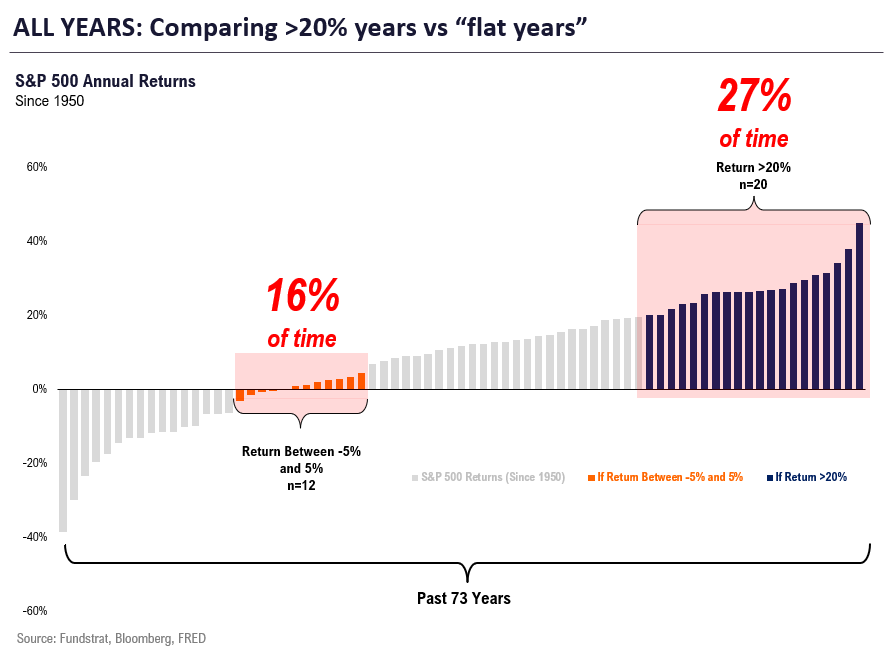
So, does a “flat year” still make sense?
As shown below, these probabilities are far higher compared to typical years:
- since 1950, based upon all 73 years
- stocks are “flat” 16% of the time vs 11% post-negative years — BIG DIFFERENCE
- stocks are up >20% 27% of the time vs 53% post-negative years — BIG DIFFERENCE
- see the point? The odds of a >20% gain are double because of the decline in 2022
We publish on a 3-day a week schedule:
Monday
SKIP TUESDAY
Wednesday
SKIP THURSDAY
Friday
_____________________________
37 Granny Shot Ideas: We performed our quarterly rebalance on 1/30. Full stock list here –> Click here
______________________________


