
A choppier period for Equities looks to be approaching and might result in SPX weakness in the back half of June. At present, short-term trends in US Equities remain bullish and lie within 2% of all-time highs. While a rally over February peaks should happen this Summer, my thoughts are the period between now and early July could allow for some consolidation ahead of a move back to all-time highs. This would gel with weak seasonality trends for June, while breadth and momentum have slowed in recent weeks. Meanwhile, the US Dollar has begun to move sharply lower, while Treasury yields have stabilized in the short run. Additionally, precious metals, Emerging markets, and commodities are all an area of near-term focus and can likely work well in the weeks/months ahead, given a falling US Dollar. Overall, a push up to between 6100-6150 is still seen as being probable for SPX before some stalling out, but the risk/reward has worsened for those with short-term timeframes.
US Equity trends remain technically bullish, but the rate of ascent has been slowing lately, and breadth and momentum have waned a bit since mid-May
While I am bullish for a move to SPX 6650 this year I am anticipating a selloff between now and early-July which could prove to be 3-5% and likely starts within a week.
My reasons for possible consolidation before a move to new highs in SPX, QQQ have to do with the following:
- Combination of slowing breadth, momentum
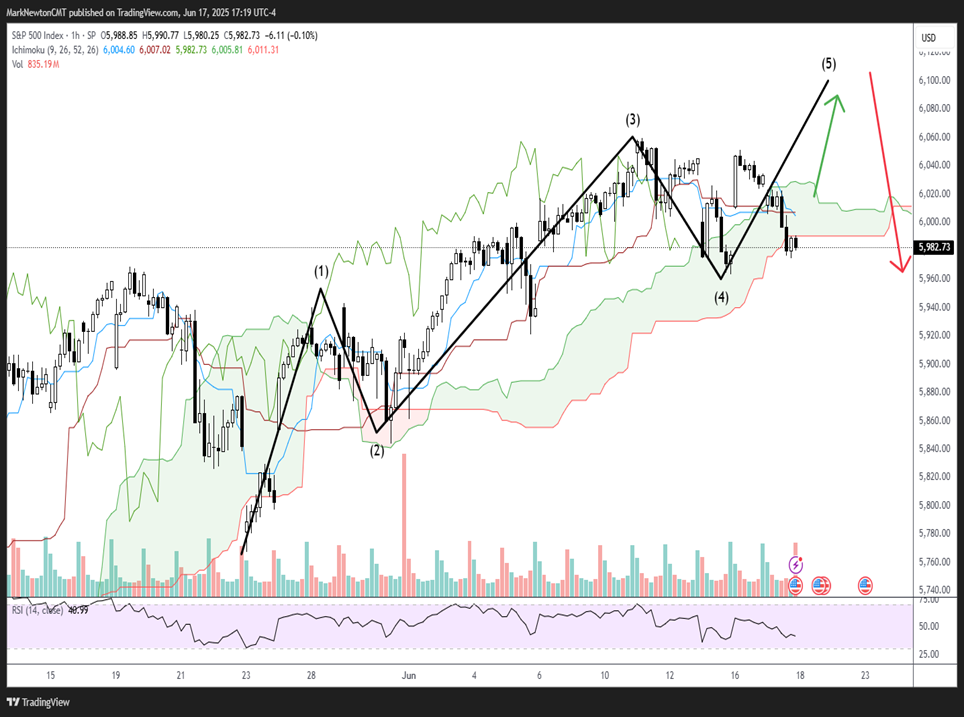
- The Elliott wave pattern from April is nearly complete. This could be completed at 6100-6150 on Thursday/Friday of this week
- Counter-trend DeMark signals
- Sentiment has grown less bearish
- Seasonality/Cyclical concerns
Overall, it’s not wrong to say that investors are slowly throwing in the towel on bearish bets, despite the geopolitical Tension starting to grow.
However, bullishness hasn’t really been too pronounced. When eyeing Risk reversal pricing for QQQ, it is showing the highest cost to hedge a 10% Decline since April
My preferred path remains for SPX to push up above mid-June highs before SPX begins a 3-5% drawdown.
However, two key areas are worth watching as support:
5963.21, the lows from last Friday, will initially be important to hold on to the minor pullback that started yesterday (Monday-6). While this could be tested, at this time, I’m not expecting much of a break of this level.
5939.92, the 5/28/25 intra-day peak is also important. This has more importance, and can’t be broken without thinking the peaks are already in place.
For now, despite a mild slowdown, near-term trends remain bullish and can still make the case for gains in the days ahead.
S&P 500 Index
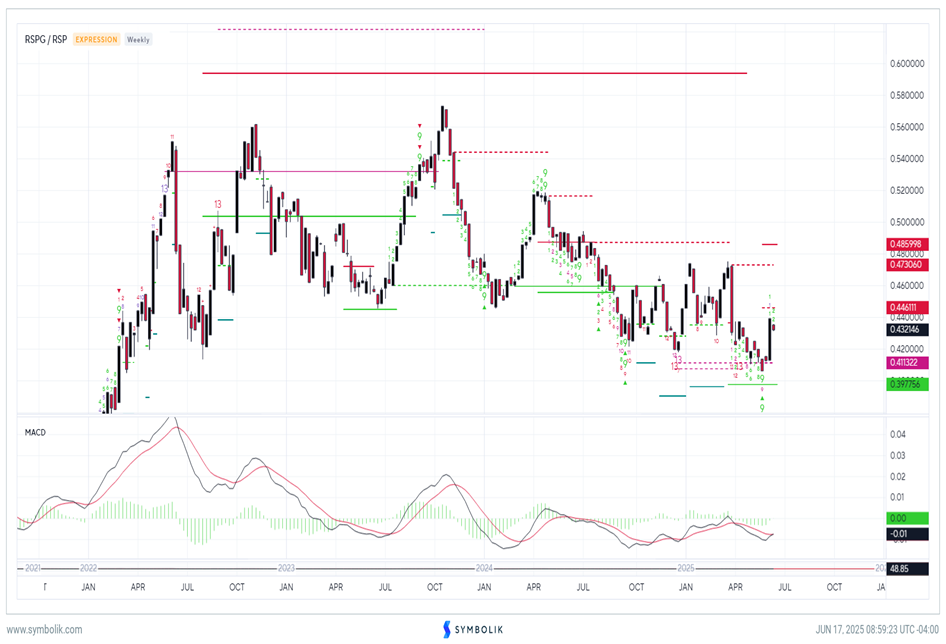
Energy’s rally to multi-week highs vs. Equal-weighted SPX is likely an intermediate-term positive but requires consolidation
Interestingly enough, the ratcheting up of geopolitical tension between Israel and Iran in the last week has caused a meaningful rally in WTI and Brent Crude Oil.
As shown below, this managed to confirm weekly DeMark exhaustion signals based on TD Sequential in the ratio chart of (RYE 0.94% /RSP -0.68% ) (Invesco’s Equal-weighted Energy ETF vs. Equal-weighted SPX) while also resulting in weekly MACD crossing the signal line back to positive territory.
Given no evidence of tension easing anytime soon, this is mildly bullish for Energy and for WTI Crude oil in the short run.
However, given the bearish downtrends intact for relative charts of Energy along with WTI Crude, I’m holding off on adjusting my technical rating on Energy at this time.
My expectations are that even if Energy has begun its bottoming process, there will be some meaningful mean reversion back lower in recent gains into July, which should provide an opportunity to take a closer look at WTI Crude and Energy.
However, following a 4.5% rally in Equal-weighted Energy in the last week, this sector is definitely on the radar, and I’ll be watching for evidence of either further strengthening to result in breakouts in WTI Crude, or pullbacks in the back half of June which might make Energy a bit more attractive from a risk/reward standpoint.
RSPG/RSP
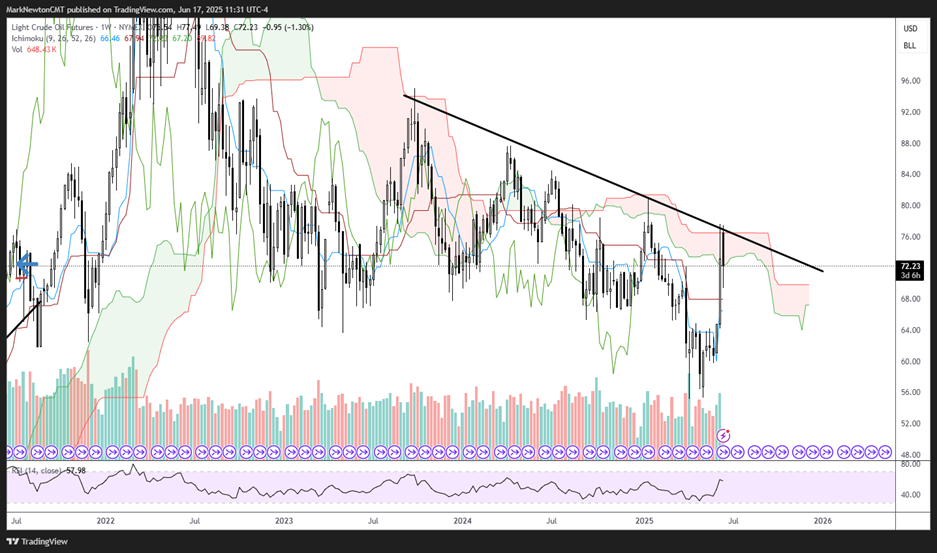
WTI Crude’s rally has pushed higher to test the multi-year downtrend line resistance
Crude’s surge in recent days has caused prices to push higher to test a downtrend that’s been intact for WTI Crude oil Futures since 2023.
While I acknowledge that WTI Crude having recouped former lows is the first step in the process towards thinking Crude might be bottoming, more needs to happen to have real confidence.
Movement up to the high $70s would successfully exceed this multi-year downtrend, which should make for consolidation into July.
Light Crude Oil Futures
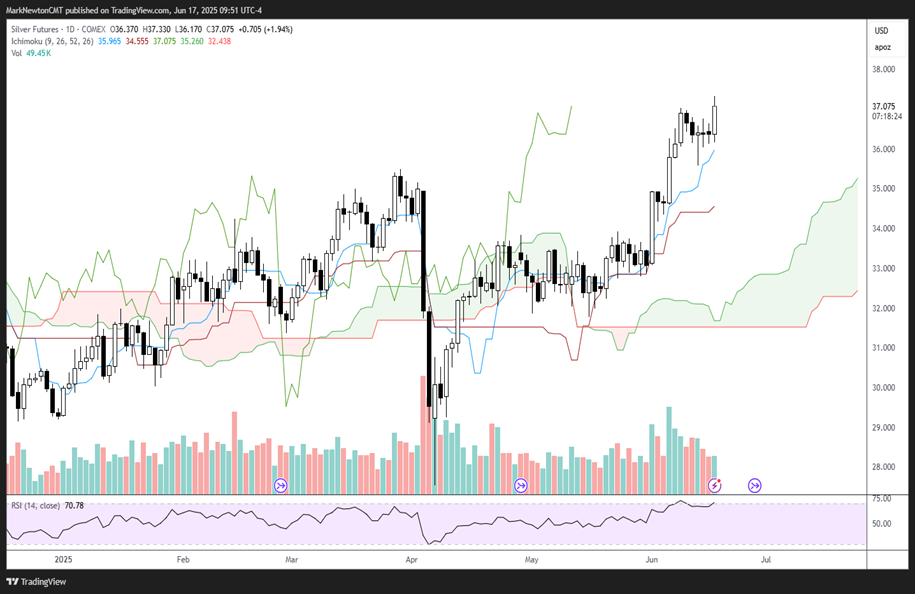
Silver’s recent outperformance over Gold is beginning to accelerate on Tuesday’s breakout
Silver has now pushed to new highs for 2025 following Tuesday’s close and has outperformed Gold since early April.
I expect this outperformance can likely persist in the months to come, and favor owning Silver for a move to $41.
Tuesday’s close above the minor consolidation looks quite constructive, technically speaking, and should jumpstart some additional gains in Silver into July.
The relative chart of SLV 2.50% to GLD 0.48% (not shown) has been outperforming since April and looks very close to exceeding a lengthy 1+ year downtrend. This would allow Silver’s outperformance to continue and bodes well for a push to the low $40’s, with initial technical targets in front month Silver Futures of $41.
Silver Futures
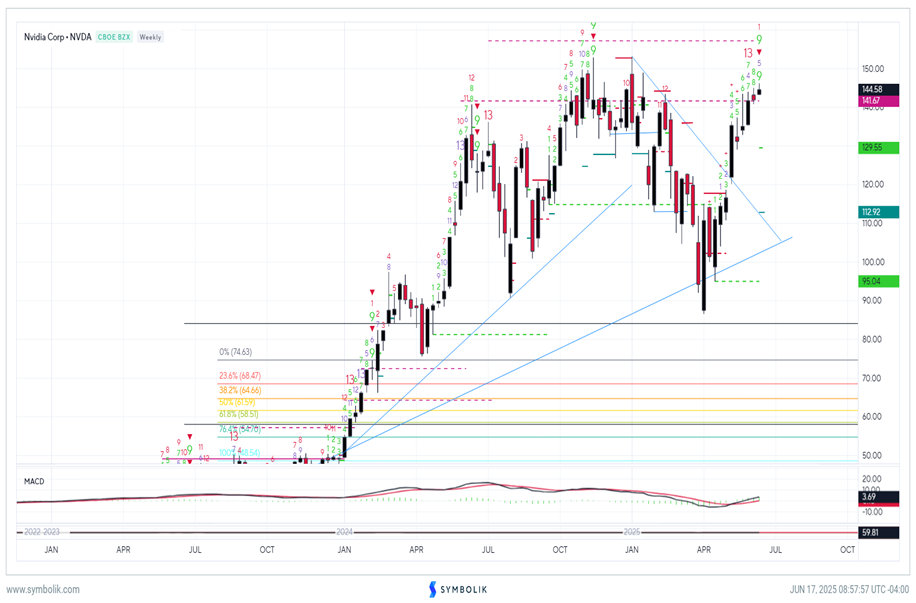
NVDA weekly counter-trend Sell signal could be in place by this Friday, arguing for minor consolidation
One chart that argues for possible consolidation in NVDA is Symbolik’s weekly chart with DeMark indicators illustrated.
As can be seen, there is the presence of TD Sequential weekly “13 Countdown” exhaustion, along with a potential TD Sell Setup.
QQQ has a similar TD Sell Setup and these indicators often result in at least a minor stalling out after these signals have been confirmed.
Confirmation has not happened as of yet, but it’s worth paying close attention to this given that a similar signal worked well last July 2024 as a Sell, along with a buy signal in 2022.
Overall, NVDA likely might not face much consolidation given how bullish the weekly momentum gauges are right now. However, weakness down to $132, or below to $123.50, should represent excellent buying opportunities for NVDA, technically speaking. My intermediate-term technical target for NVDA on a move above all-time highs of $152.89 lies near $180 for 2025.
Nvidia Corp