The S&P 500 index’s (SPX) historic decline last week sliced through most of the moving averages at the heart of technical analysis, with a break below the 200-week simple moving average at 2636 the most recent casualty. That four-year moving average is a proxy for the secular uptrend of the SPX seen during the bull markets in the 1950s-1960s, 1980s-1990s and 2009-2020.
In other words, the break below the 200-week sma at 2636 raises the risk the recent equity sell-off has ended the secular bull-market. Of course, the 20% plus drop already herald’s the bear market’s arrival.
While this week’s break below the 200-week is a major concern, particularly given the looming global economici slowdown, I believe it is premature to conclude the secular bull market is broken. Of course, I am concerned and not blindly ignoring the risk to equities, but I also believe there are two key technical points to consider before we can declare the secular bull market to be DOA.
Is the secular uptrend broken with SPX below its 200-week sma or just dented?
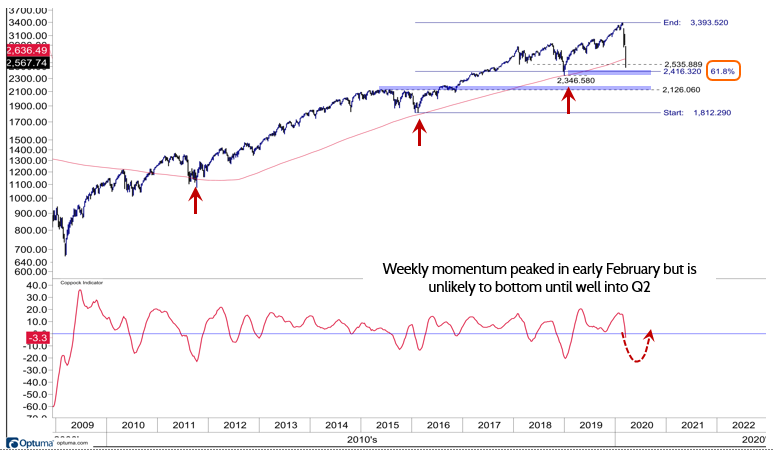
First, the chart above illustrates the past three pullbacks to the 200-week sma since 2009. The cycle lows in 2016 and again in December of 2018 were almost textbook examples of a major cycle low developing at that key support level. The correction in 2011, however, could be what is developing today.
It’s premature to make any definitive conclusions, but the low in 2011 undercut the 200-week sma by 5-6%, then traded in a very volatile range only to make a marginal new low a month later before recapturing 200-week sma on the upside. Additionally, the four-year cycle lows in late 1957, 1962 and 1966 spent many weeks in volatile ranges below 200-week sma before reaccelerating to the upside 1-3 months later.
I would also note that Friday the SPX was near a cluster of key support levels starting with 2416 which is the important 61.8% Fibonacci retracement level of the 2016-2020 rally followed by the December 2018 lows at 2346. I can’t state for sure these levels will hold but it would be an important technical development to see the S&P begin to stabilize near current levels. Keep your eyes on that.
Secondly, after peaking in early February, weekly momentum indicators continue to decline and are unlikely to signal an intermediate-term, tactical bottom until well into 2Q. I expect these should begin to bottom in late April-May, which coincides with markets better understanding the scope of Covid-19 and potential impact to earnings.
Bottom line: My expectation is that the S&P is likely to begin to stabilize near the support levels outlined above followed by a very choppy trading well into 2Q similar to what developed in 2011 and during the cycle lows in the 1950s.
Figure: Weekly Sector Review
Source: FS Insight, Factset
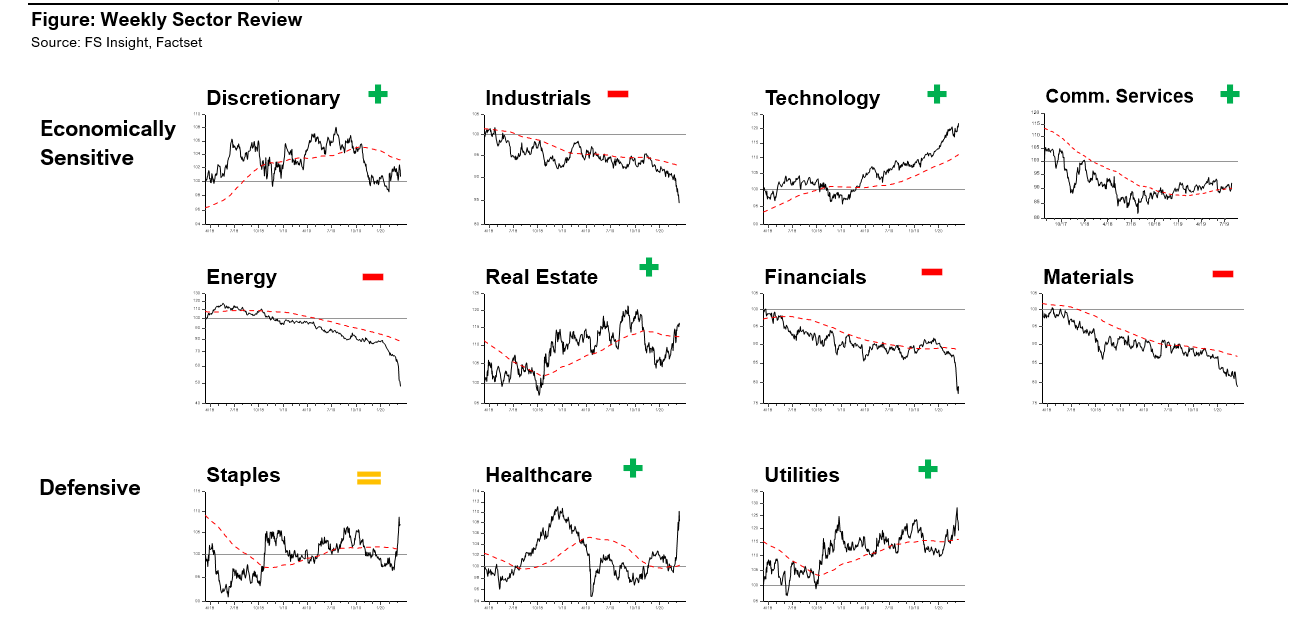
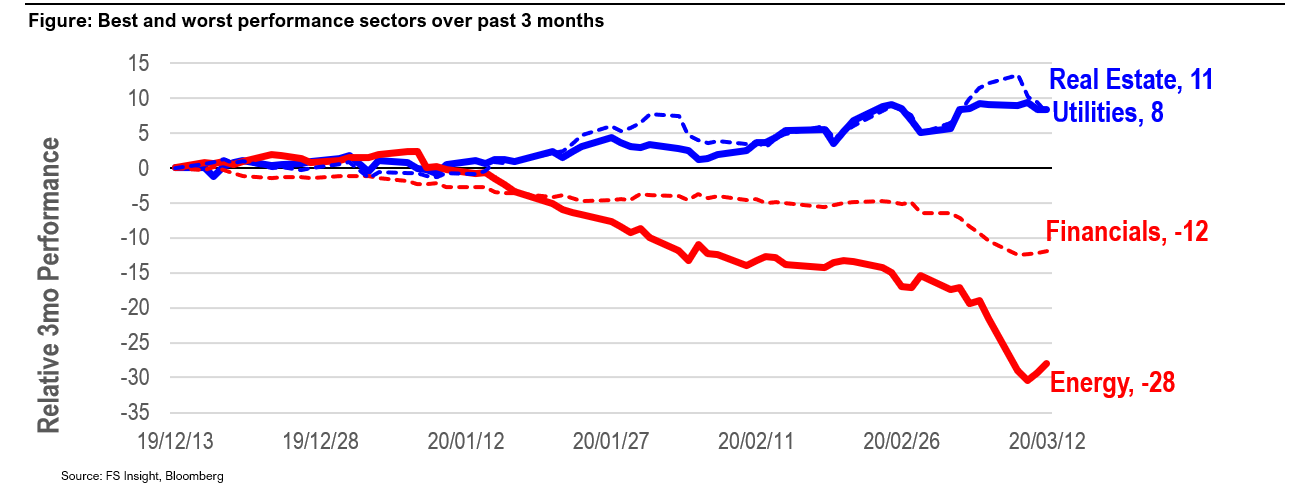
Figure: Best and worst performance sectors over past 3 months