


It is nearly a universally held—albeit logical—view that equity markets are currently carving out a top, that the ‘end’ is nigh. I find myself involved in recurring conversations with investors and businesspeople I encounter: the Standard & Poor’s 500 index is topping, they assert. Why?
Well, the market is facing too many risks from China/US trade war, Brexit, low rates, etc. It’s just a matter of time. They see little reason to think markets can rise since they have been going up for 11 years already. The logic there, admittedly, is faulty. This is consensus thinking, which is sometimes right but is often enough wrong. When that happens investors could make hay by going against it.
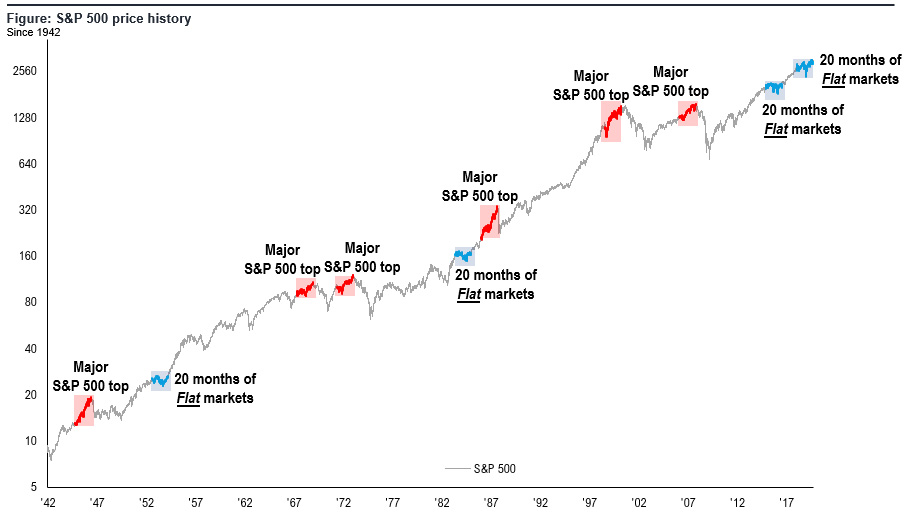
This consensus view strengthens my contrarian conviction that an upside market breakout is coming for S&P 500 index. It’s possible that this rise could be potentially significant, if history is any guide. As I have pointed out previously, since 1945 there have been six major tops, which were followed by a 30% or greater decline in equity prices. However, the major tops, highlighted in red, show an accelerating rise in the 20 months leading to the highs.
Instead, flat markets that are “going nowhere” were resolved with substantial upside moves. What we see in 2019, a flat market while hovering near all-time highs, is actually uncommon. Since 1945, this has happened only three times, which highlights the rarity. History suggests plateaus are a base before a strong up move.
Meanwhile, investors seem to carry 2008 hammers looking for 2008 nails, using the previous crash as a template for the next one. The current situation does not resemble 2008. However, burned by the financial crisis, investors remain largely too pessimistic, something chronic since 2009. What is notable is the conviction many have that 2019 is 2008 all over again, citing repo market weakness, inverted yield curves and high levels of debt. The maturity of the 2002-2008 expansion was evident by late-2005 (when the 3 measures above largely peaked). Similarly, post-internet bubble (2003), investors kept looking for the tech bubble to burst again.
Skepticism about the health of the business cycle is rising. Of course, there are understandable factors: China/US trade war, resulting visible weakening of global purchasing managers indexes; inversions of yield curve; underperformance of cycle leaders (FANG), and the poor performance of recent IPOs. This combination could naturally feel late-cycle, but, again, a surprising number of our clients see parallels to the events in 2008.
That said, the US still looks more mid-cycle than late. Economic expansions end when incremental returns on invested capital turn negative, due to one of multiple factors: (i) exhaustion of labor pool; (ii) overinvestment (capacity utilization or investment as a percentage of GDP) and (iii) excessive debt service crowds out spending.
Yet, in the US currently, the employed as a percentage of the population is 61% vs 63%- 65% in prior peaks, implying a 6 million to 10 million jobs growth before peak. Meanwhile, private investment/GDP is 24% vs 28% peaks, which suggests $800 billion further, and finally debt service for government, corporates and households is well below typical peaks. See chart.
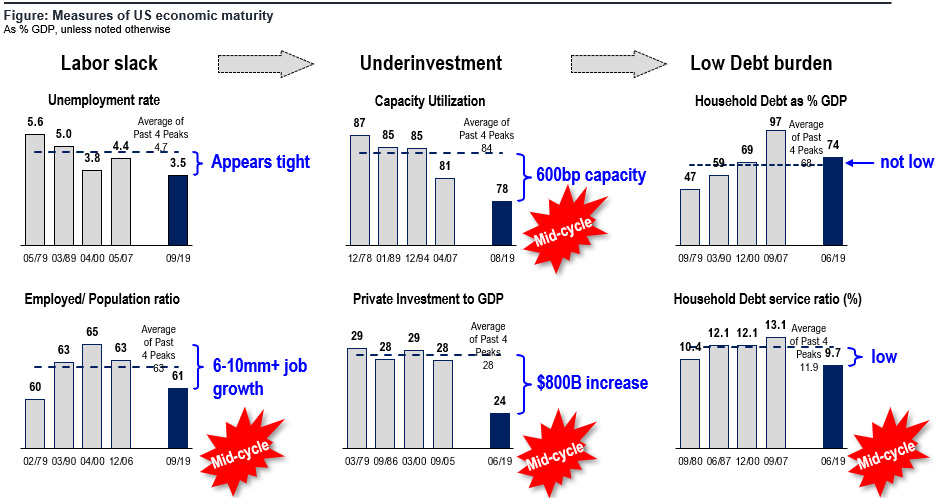
Basically, it comes down to these observations: (i) there remains plenty of labor slack. Our work still argues the U.S. “unemployment rate” overstates the strength in the labor market. (ii) investment spend is too low. Two measures of private investment spending maturity, capacity utilization and private investment to GDP ratio shown in charts, are still well below what is typically seen at expansion peaks. (iii) US debt service, much more important because this is what ultimately crowds out private spending, is the lowest compared to prior cycles due to our low interest rate environment.
Despite a surge in federal debt as percentage of GDP, debt service requirements remain at record low levels. In other words, by a comprehensive set of measures, the US still has plenty of room to grow.
My 2H19 thesis remains “flat markets going nowhere” resolve to the upside, which will surprise most investors. Equities have gone nowhere for 20 months, yet hover near alltime highs. This has been seen three times since 1945 and all three were resolved by a significant upside breakout—average gain 51%. I see a rebound in the next few months, coinciding with a bottoming of Purchase Managers Indexes. An end to the GM strike also strengthens this case.
What could go wrong? Investor confidence is weak due to impeachment, trade uncertainty, market volatility. And this could result in a self-fulfilling contraction.
Bottom line: I still look for a year-end rally and overweight cyclicals, on the premise of a bottoming of PMIs. Interesting tickers are KSS, LEN, PHM, EXPE, LMT, CAT, EMR, ROK, CSCO, QCOM, XLNX, MSFT, EMN, CF, NUE, TTWO, VIAB, DISCK, ATVI, GOOGL and FB.

Per FS Insight
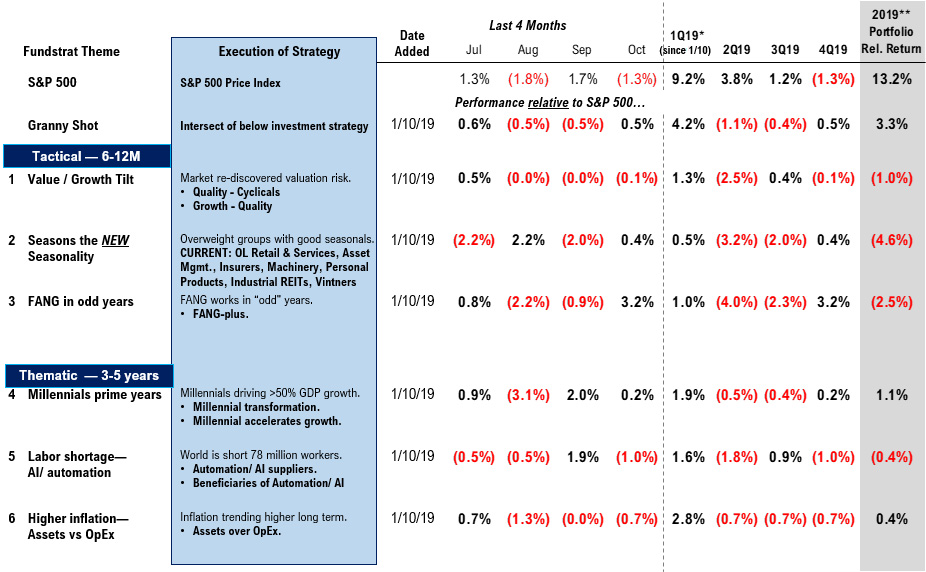
** Performance is calculated since strategy introduction, 1/10/2019


