
Hitting the Reset Button
Key Takeaways
- We see Bitcoin’s recent price action coupled with a lack of substantially leveraged positions as an encouraging sign.
- Hash rate has surged since Friday’s washout, pointing toward a network of miners that feel optimistic about the near-term trajectory of the BTC price.
- SOPR indicates that the majority of selling pressure is coming from short-term investors who lack conviction in Bitcoin’s current price trend.
- MVRV has decreased, implying a higher network cost basis, which we view as positive for Bitcoin’s near-term potential.
- Bottom Line – By no means was last weekend fun, but volatility is a feature and not a bug for Bitcoin. While we cannot rule out some near-term consolidation, we believe the on-chain and macro setup still looks bullish through year-end and into Q1 for Bitcoin. Additionally, we still see the potential for Ethereum outperformance and view our altcoin baskets (highlighted in last week’s analysis) as an opportunity for those venturing further out on the risk curve.
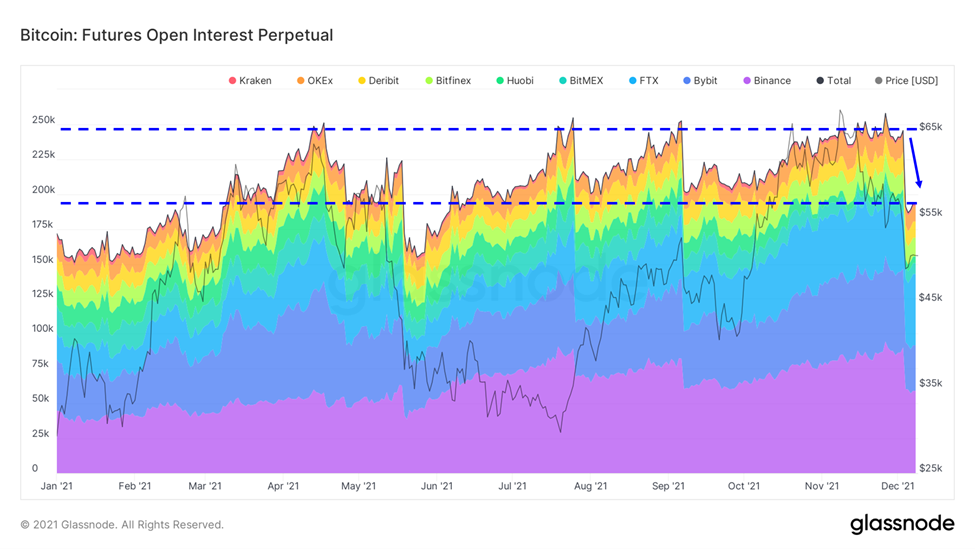
Open Interest Remains Subdued
To recap, Bitcoin’s price dropped precipitously on Friday evening in the wake of cascading liquidations of leveraged positions across multiple exchanges. According to data from Coinglass, on Friday, December 3rd, over $2 billion in long positions across the global crypto market were liquidated, nearly $850 million of which were from BTC contracts.
Below we can observe a significant flush of leverage as denominated in BTC. Total open interest dropped by over 70,000 BTC or 18% by Sunday morning.
As of late Wednesday evening, open interest remains at a level last witnessed during the summer months, when the markets were still recovering from a massive sentiment-driven drawdown in May.
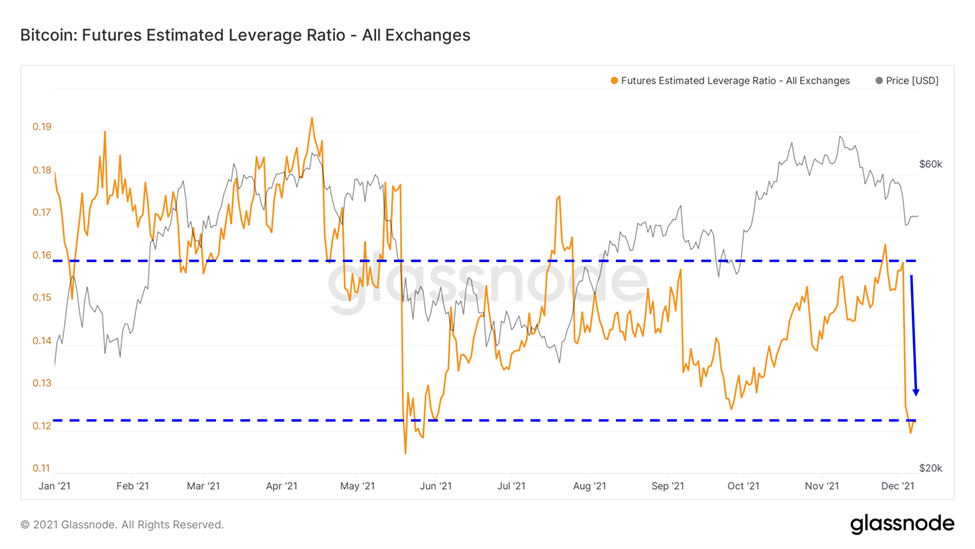
Similarly, the futures estimated leverage ratio (futures contracts / BTC on exchanges) was reset and has yet to rebound significantly.
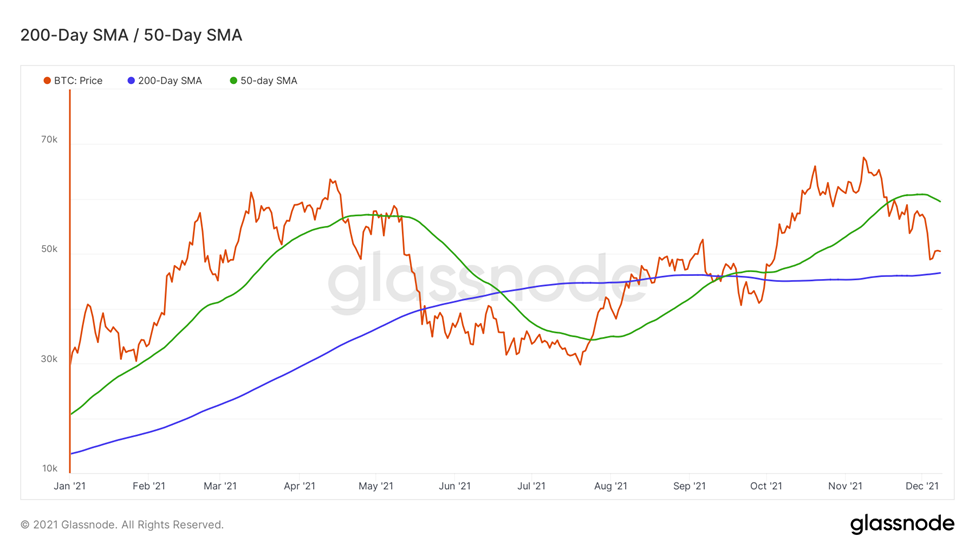
Support at the 200-Day
On Sunday, we mentioned in our note that we would keep our eyes peeled for any retests of the 200-day SMA, a historically crucial technical level for Bitcoin. Since the leverage washout, we have yet to witness any significant attempts at breaching this level. Bitcoin has increased nearly 20% from the (very brief) low of $42k on Friday night. The broader crypto market has erased approximately half of the losses incurred as the global crypto market cap hovers around $2.35 trillion at the time of writing.
We see Bitcoin’s recent price action coupled with a lack of substantially leveraged positions as an encouraging sign.
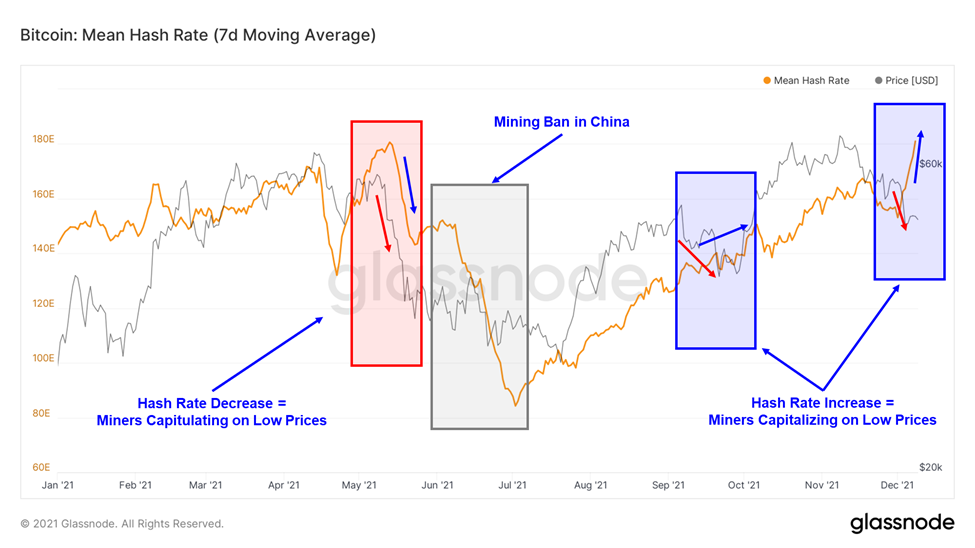
Hash Rate is Booming
One of the more positive signs to catch our eye this week is the network hash rate. Hash rate, or the total computing power dedicated by miners to secure the Bitcoin network, has soared since Friday’s drawdown and is quickly approaching a new all-time high.
Historically, during periods of capitulation, we have witnessed hash rate drop in concert with price as miners lack confidence in the near-term price trajectory of Bitcoin and wish to preserve margins by turning off their machines.
Interestingly, we note that the last time we experienced a significant price drawdown (September), miners were steadfast in serving the network, as the hash rate held steady in the face of several red candles. In retrospect, this was a positive sign for near-term performance. This time around, the reaction by miners was even more pronounced as the liquidation frenzy on Friday preceded a substantial jump in hash rate. We see this as a positive development as miners are likely adding capacity to the network in anticipation of positive price performance.
To be clear, we think a part of this dynamic can be attributed to the migration of the Chinese hash rate to the US. Frothy US capital markets have enabled domestic miners to be well-capitalized and consequently can risk mining at somewhat lower margins than miners in China. However, we think the degree to which hash rate spiked points toward a network of miners that feel optimistic about the near-term trajectory of BTC price.
Profitability On-Chain
Below we map out entity adjusted SOPR (Spent Output Profit Ratio), which measures the profitability of all coins sold.
During periods of favorable price action, this metric tends to drift higher as holders maintain their positions with the objective of selling at an increased level of profitability. During times of consolidation or weakness, this metric will often either hit 1 (break-even) and return to negative levels or remain soundly in negative territory, an indication of capitulation among investors who choose to sell at a loss.
This week, we witnessed the network break through this level as some wallets sold their coins at a loss. Presently, SOPR sits at exactly 1. As it stands, we are unable to derive a clear signal from this metric.
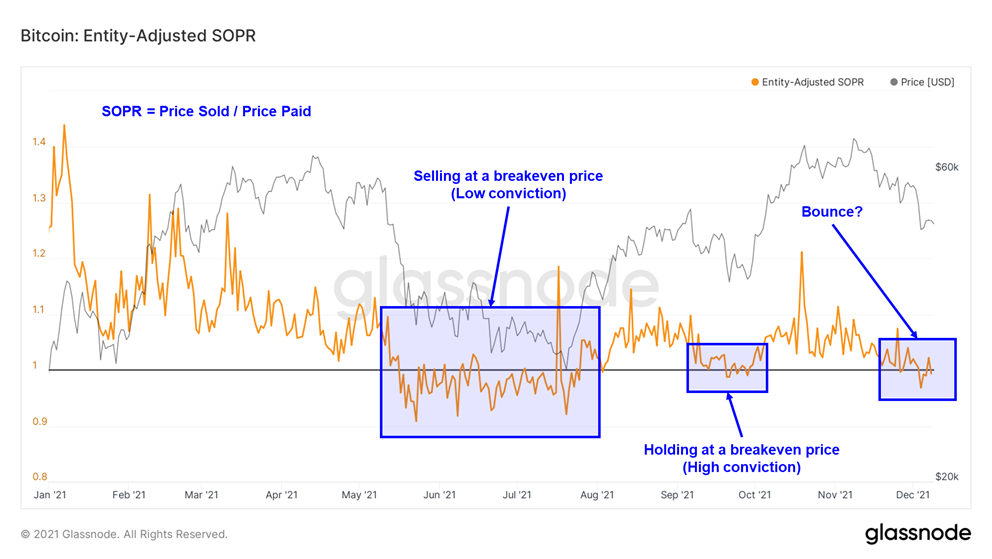
However, we can take this analysis a step further and analyze the different cohorts of investors to get a better sense of on-chain sentiment.
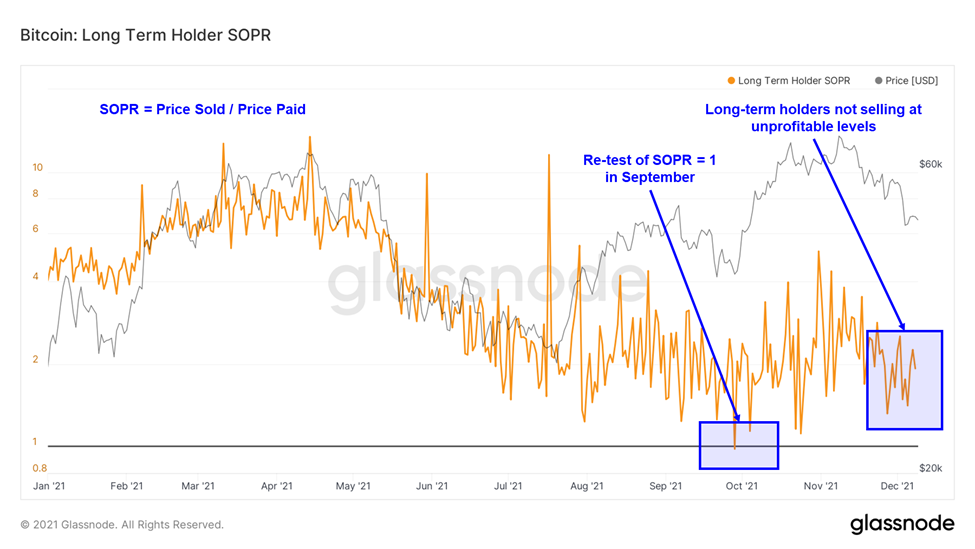
The chart below displays long-term holder (LTH) SOPR. This metric considers wallets that we generally regard as the “smart money” on-chain. These wallets have historically reduced their positions during Bitcoin’s most bullish episodes and accumulated BTC during weakness or consolidation periods.
We can see that in September, price volatility briefly tested the resolve of long-term holders as SOPR reached 1 (Some long-term holders sold at breakeven). However, LTH SOPR found ample support and started to move upwards as this cohort regained conviction and refused to sell below a certain level of profitability.
As demonstrated by the LTH SOPR action around the recent price drawdown, long-term holders did not capitulate, suggesting that the smart money is still bullish on the near-to-medium term price potential for BTC.
Taking this a step further, we can also segment this metric by short-term holders. Below we can observe the behavior of the short-term holders, who, unlike the investors in the chart above, have a considerably myopic view of the market. We can see that these holders never really get to the level of profitability of the long-term holders due to a much higher cost basis.
When sentiment is high and the price is rising, we can observe that STH SOPR repeatedly tests 1 but generally remains above this level, as short-term holders remain active participants on the way up.
However, as one would expect, this metric will dip below 1 and find resistance there when we experience weaker price action or diminished market sentiment.
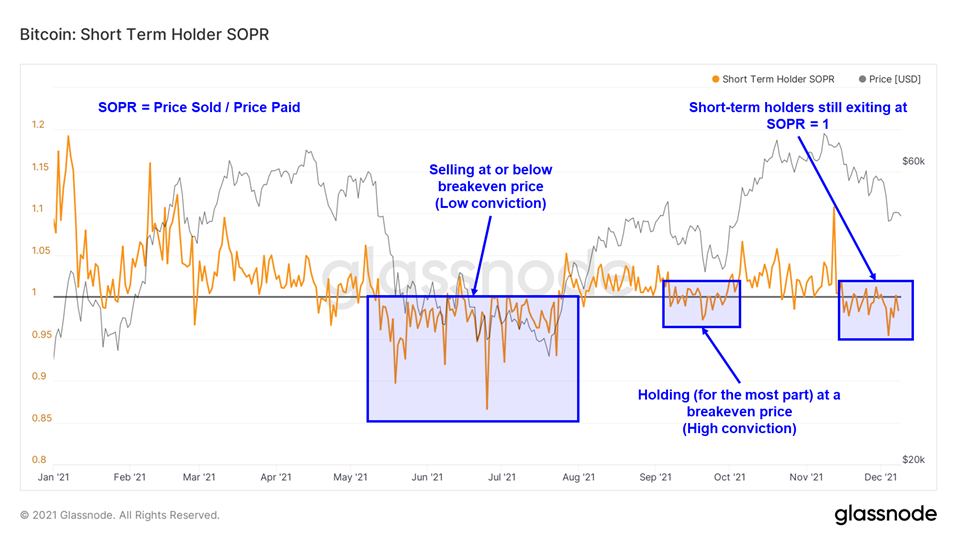
This speaks to a theme that we have touched on in prior analyses. The market requires active short-term holders to remain active to achieve periods of parabolic price increases. We will continue to monitor this metric to see if STH SOPR can find support above 1.
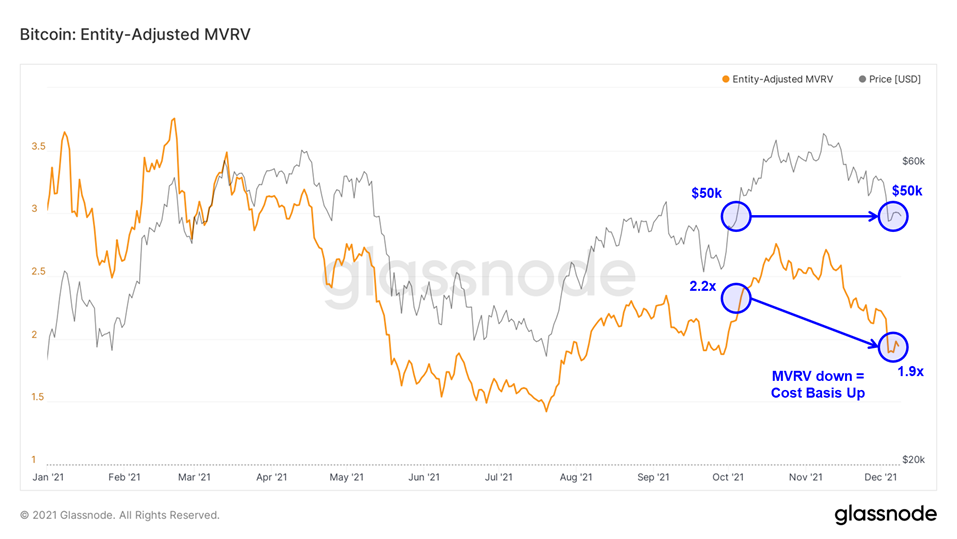
Higher Floor From Which to Leap
Compared to SOPR, which measures the profitability of coins sold, market-value-to-realized-value (MVRV) measures the profitability of coins presently held across the entire network. Naturally, the higher that this metric rises, the more selling pressure there will be from holders.
We can observe that MVRV has fallen over the past several days as the price has decreased. However, we can infer that the realized value of coins on-chain has not fallen at as rapid of a pace since MVRV has also decreased. As demonstrated by the chart below, the current BTC price of approximately $50k corresponds to an MVRV of 1.9x, whereas a couple of months ago, this same price corresponded to an MVRV of 2.2x.
This means that the cost basis, and in our view, the price potential of the Bitcoin network has increased.
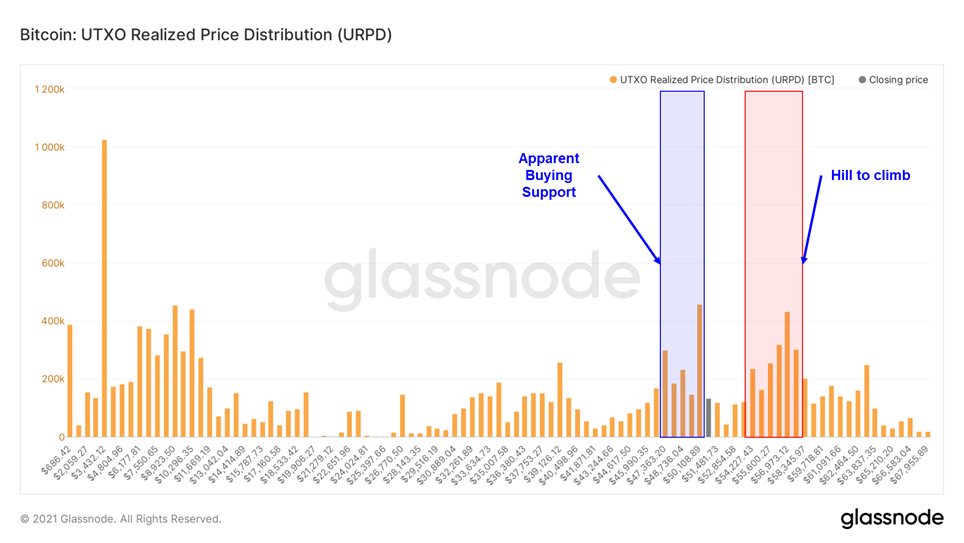
Key Price Levels
Finally, we would like to highlight Bitcoin’s current price distribution. UTXO Realized Price Distribution (URPD) displays the number of existing bitcoins that last moved within a specified price bucket. The prices on the x-axis refer to the lower bound of each bucket.
While we will always defer to our technical expert, Mark Newton, for key near-term price levels, we note that URPD indicates considerable buying support around $50k and suggests that we may see some folks seek exit liquidity in the $55k – $56k range.
Bottom Line
By no means was last weekend fun, but volatility is a feature and not a bug for Bitcoin. While we cannot rule out some near-term consolidation, we believe the on-chain and macro setup still looks bullish through year-end and into Q1 for Bitcoin. Additionally, we still see the potential for Ethereum outperformance and view our altcoin baskets (highlighted in last week’s analysis) as an opportunity for those venturing further out on the risk curve.
Reports you may have missed


BUYERS ON STRIKE Last week, we discussed our immediate-term cautious approach to the crypto market, highlighting recent geopolitical tensions, tax-related selling, negative fiscal flows, and the persistent rise in real yields as reasons for a more risk-averse positioning (albeit relative, as holding 7.5% in cash and the rest in crypto is hardly considered risk-averse in most circles). This uncertainty has persisted into this week, evidenced by what we consider an...


Fiscal Dominance, Flows from China, Plus Some Thoughts on Global Conflict (Core Strategy Rebalance)
WHAT BTC SHRUGGING OFF CPI SAYS ABOUT CURRENT FISCAL SITUATION The most significant piece of macro data this week was the CPI. Headline CPI registered at 3.5%, surpassing the anticipated 3.4%, while core CPI remained steady from last month at 3.8%, also above the expected 3.7%. This increase was largely attributed to rising costs in auto insurance and shelter. Consequently, interest rates saw a sharp rise, with the 10-year Treasury...

