
What next after BTC’s surge toward next resistance near 13.8K?

For a full copy of this report in PDF format click this link.
- After surging through resistance at the August highs near 12.5K over the past week, BTC is closing in on next major resistance near June 2019 highs at 13.8K. With short-term trading indicators pushing into overbought territory, traders are understandably questioning whether they should reduce exposure. We disagree. Sure, a near-term dip or pause is likely given the recent rally, BUT the longer-term term technical structure continues to improve suggesting pullbacks are likely to be short lived and relatively shallow. Based on the following bullets and accompanying charts, we remain bullish on BTC’s longer-term prospects and rather than attempting to micro manage trading position, maintain exposure using pullbacks and pauses to further increase exposure.
Key technical developments
Improving long-term price structure following 2018-2020 consolidation – BTC’s price structure is incrementally transitioning into a new long-term uptrend following its very broad 2018-2020 consolidation above its long-term structural uptrend defined by the 200-week sma. BTC has reversed its 2018-2020 downtrend with a series of higher highs and lows following the March collapse in all risk assets. Bottom line: BTC...Reports you may have missed

BITCOIN (BTC) “CRYPTO-WINTER” LOOKS TO BE OVER. A BULLISH 2024 LOOKS LIKELY TECHNICALLY FOLLOWING A 1Q CONSOLIDATION. Bitcoin looks to be giving off strong signals that the crypto-winter that has kept most coins in bear markets over the last couple years has finally run its course. The act of having taken the lead ahead of many cryptocurrencies in finally surpassing the 50% retracement area of its entire decline from 2021...
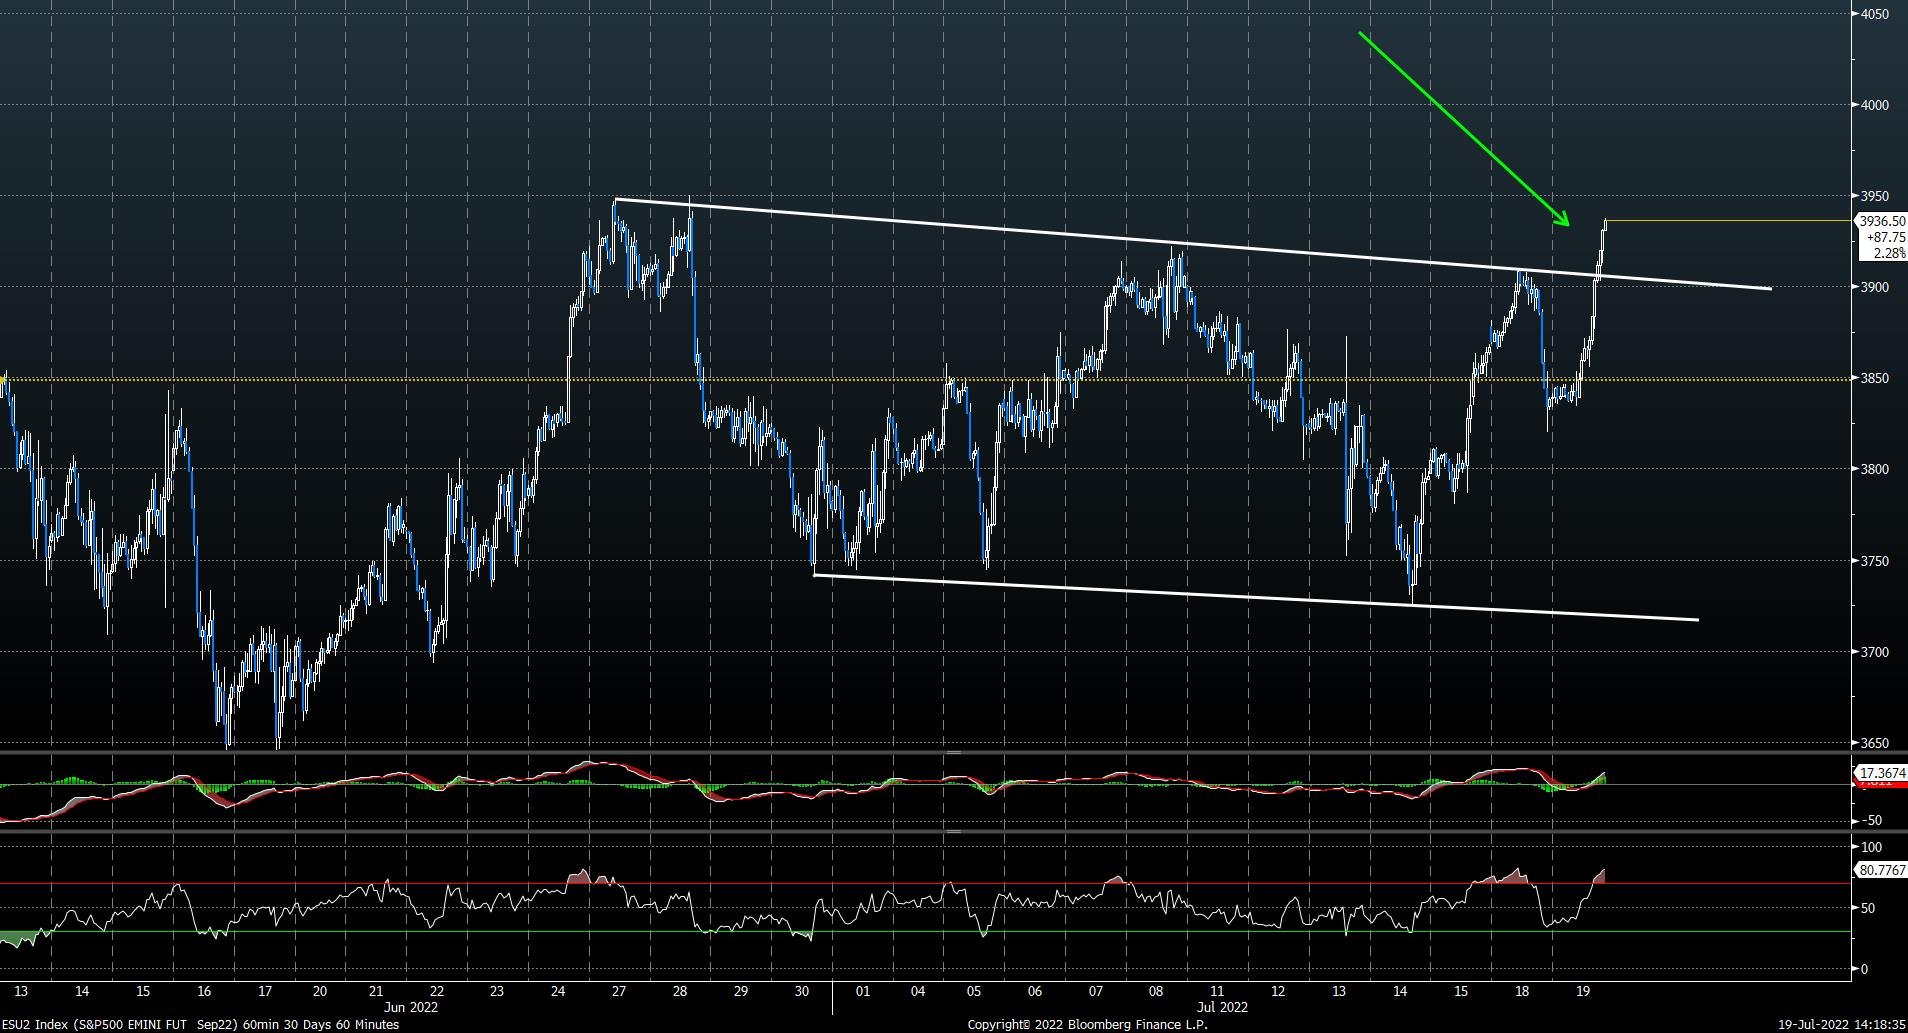
Tuesday produced nearly a textbook breakout which not only exceeded late June and early July highs in ^SPX 0.43% , but also successfully exceeded 3-4 month downtrends for ^SPX 0.43% and DJIA 0.55% . Seven of the 11 S&P Select SPDR ETF’s were higher by more than 3%, and volume was nearly 10/1 bullish on NYSE and NASDAQ, producing a “90% Up day” in volume. Hourly charts show this breakout above the two former peaks...
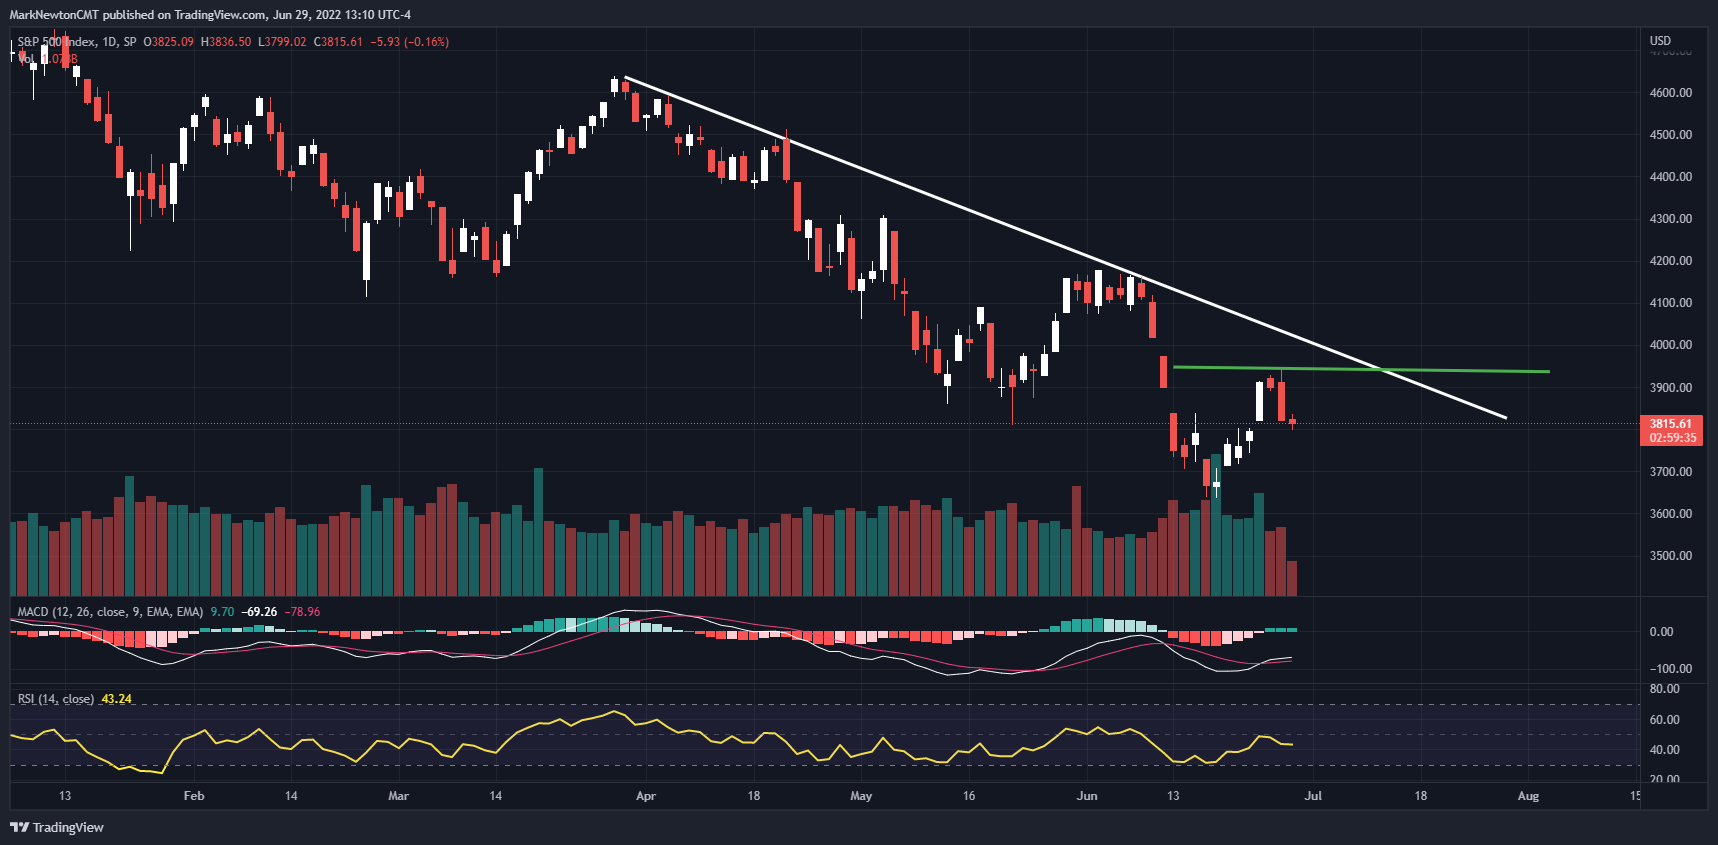
The SPX showed just minor downside follow-through after Tuesday’s reversal but might not immediately weaken down to prior lows ahead of the US July 4th holiday. As mentioned, prices reversed on cue Tuesday due to a combination of Elliott-wave analysis with Gann analysis which provided price and time targets based on the prior June 16th bottom. I expect that the next couple days might show prices attempting to stabilize and...

Cryptocurrency rally looks to have temporarily stalled out after a sharp three-week rally. Ethereum has stalled out in its relative performance vs Bitcoin, and for now, Bitcoin is an outperformer over Ethereum and should be favored. Weekly momentum remains negative and Cycle composites start to turn lower in early March into April/May, so given low retail interest and not many inflows, this could limit the larger rally continuing to all-time highs...
