
BTC surges > 200-dma toward resistance at 9K – Daily RSI overbought

BTC recaptures a key technical threshold accelerating above its widely monitored 200-dma. BTC surged above a key resistance level at its 200-dma toward its next resistance near 9K coinciding with a 76.4% retracement of the Q1 decline and the early March highs at 9.2K.
Given daily RSI and the 4-hour RSI have now moved into overbought territory, our expectation is for a short-term pause pullback to develop with first support near 8K near the 200-dma and 62% retracement zone.
Stepping back - The big picture: A broad basing profile rally from a longer-term rising uptrend - BTC’s 3-year chart profile remains in a downtrend from the 2018 highs with the Q1 2020 highs near 10-10.5K the key upside resistance band that will need to be exceeded to confirm a longer-term upside trend reversal. Recognizing the risks of pre-judging technical patterns before they resolve one way or another, we are viewing the incredibly volatile trading range since 2018 as a longer-term basing/consolidation profile that has bottomed near its long-term uptrend (200-week sma) and will likely resolve the bigger multi-year pattern to the upside over the coming 2-4 quarters.
Reports you may have missed

BITCOIN (BTC) “CRYPTO-WINTER” LOOKS TO BE OVER. A BULLISH 2024 LOOKS LIKELY TECHNICALLY FOLLOWING A 1Q CONSOLIDATION. Bitcoin looks to be giving off strong signals that the crypto-winter that has kept most coins in bear markets over the last couple years has finally run its course. The act of having taken the lead ahead of many cryptocurrencies in finally surpassing the 50% retracement area of its entire decline from 2021...
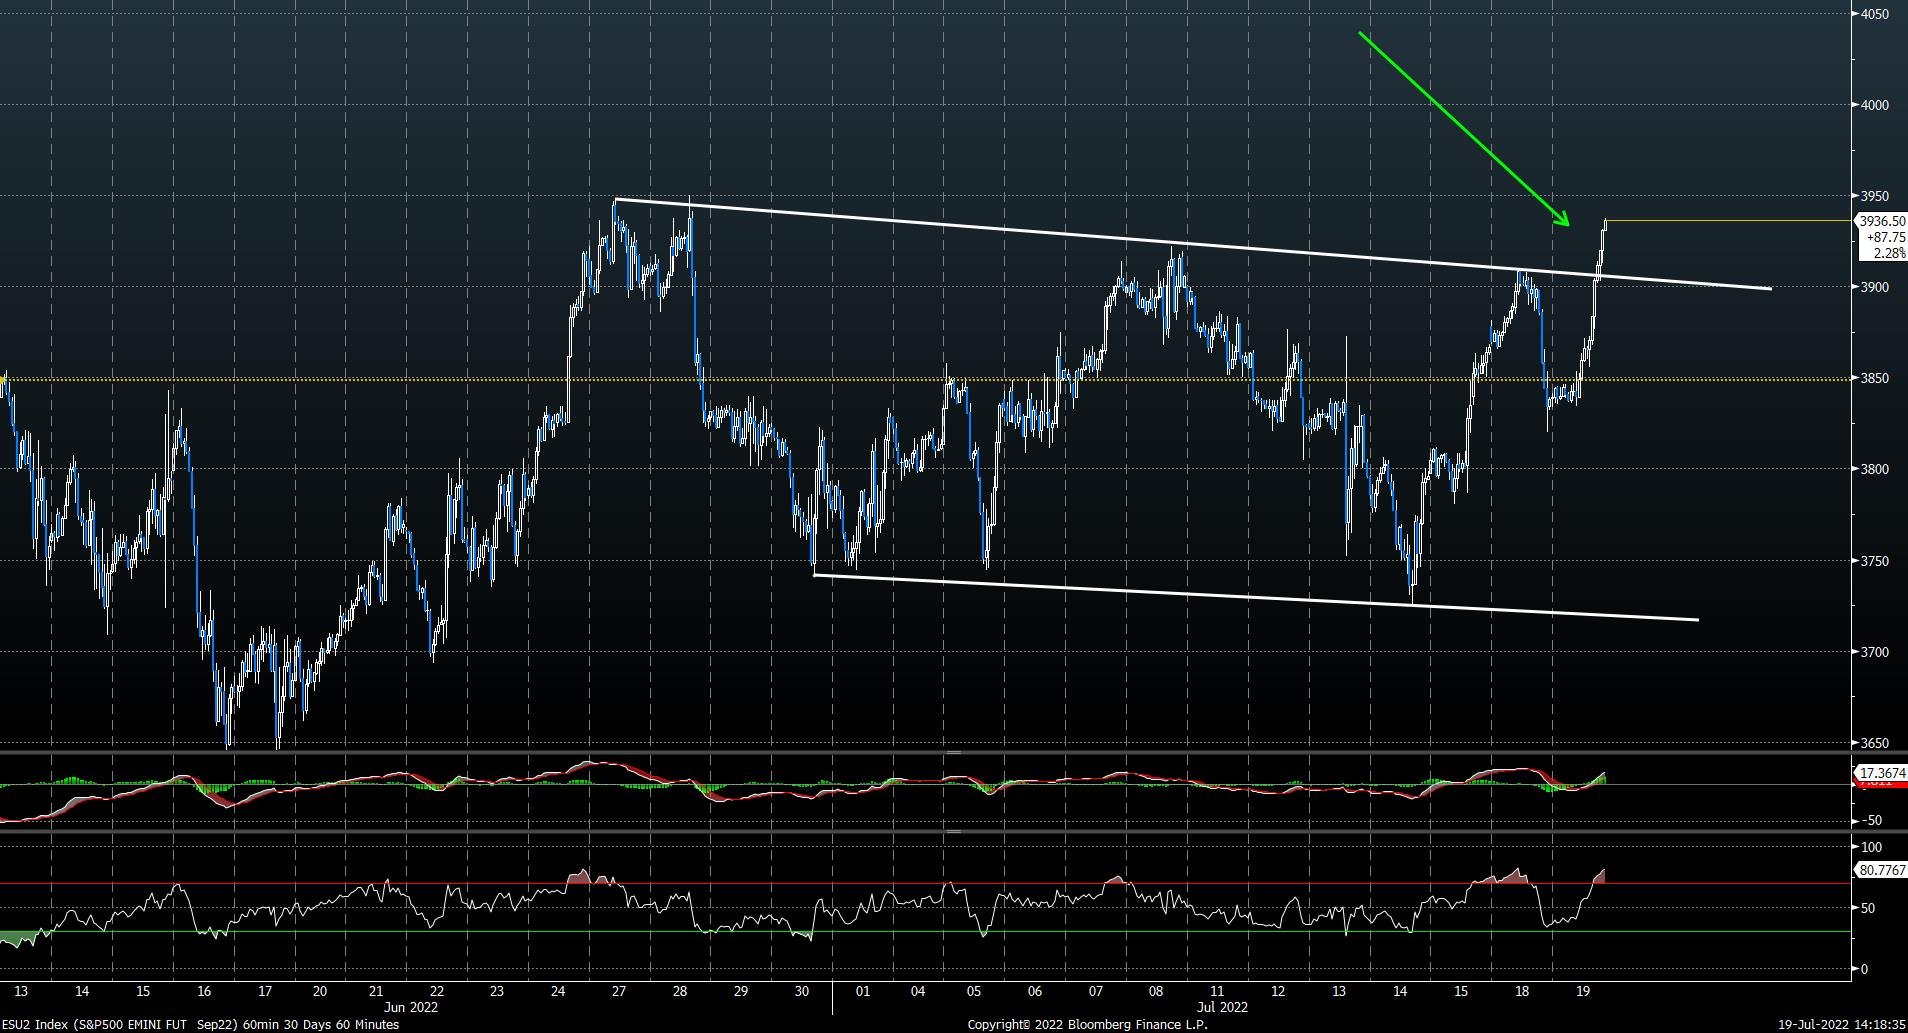
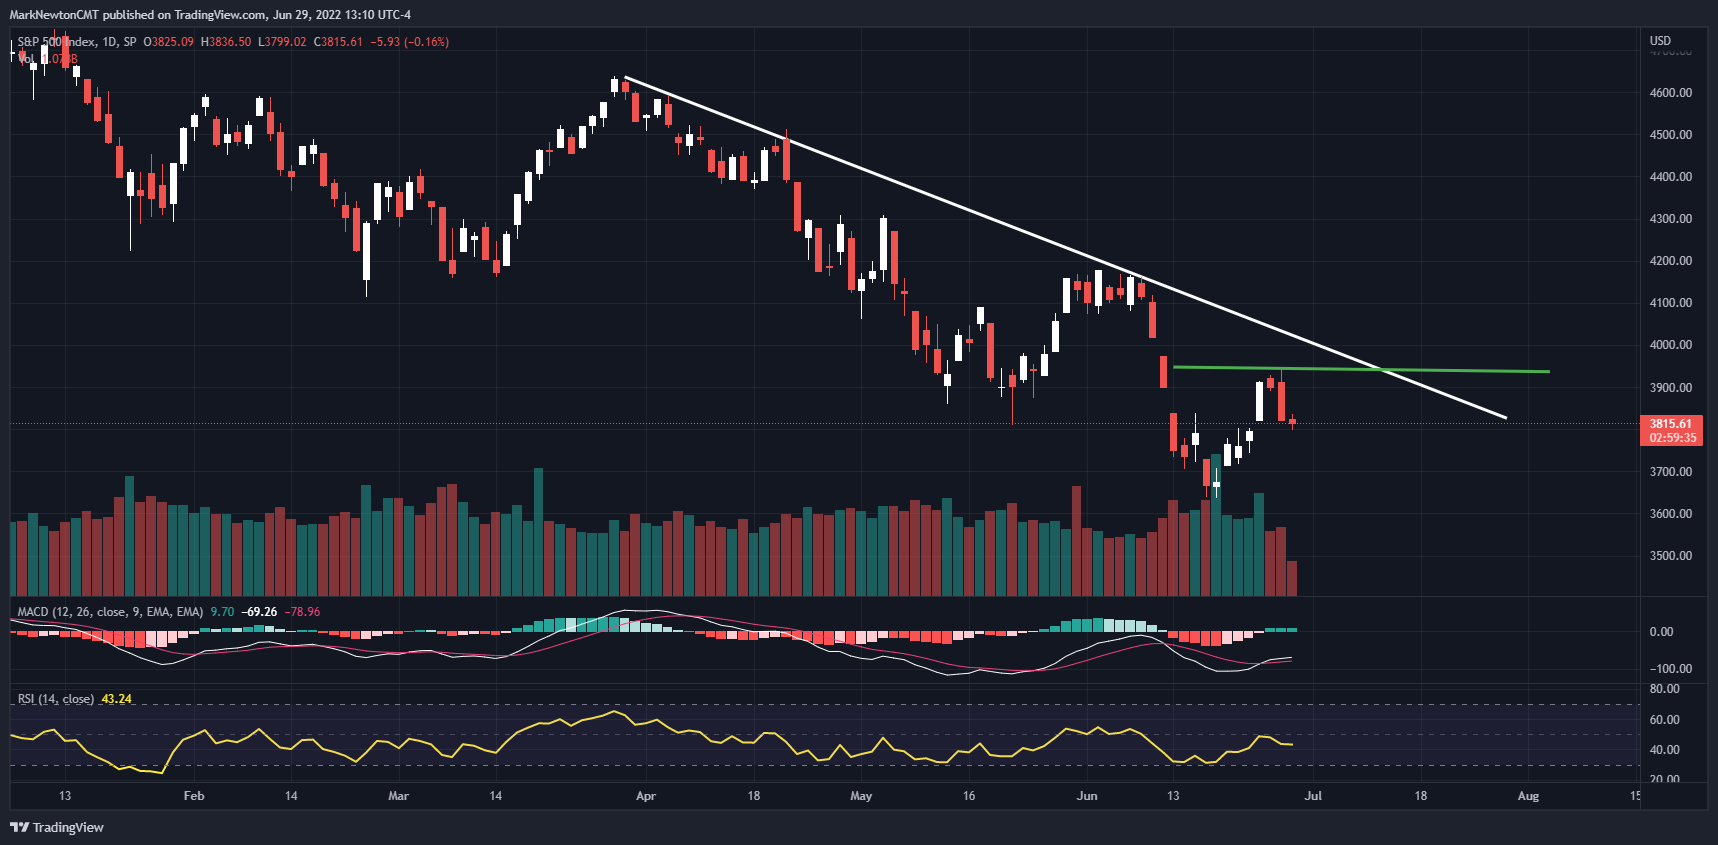
Tuesday produced nearly a textbook breakout which not only exceeded late June and early July highs in ^SPX 0.60% , but also successfully exceeded 3-4 month downtrends for ^SPX 0.60% and DJIA -0.13% . Seven of the 11 S&P Select SPDR ETF’s were higher by more than 3%, and volume was nearly 10/1 bullish on NYSE and NASDAQ, producing a “90% Up day” in volume. Hourly charts show this breakout above the two former peaks...
The SPX showed just minor downside follow-through after Tuesday’s reversal but might not immediately weaken down to prior lows ahead of the US July 4th holiday. As mentioned, prices reversed on cue Tuesday due to a combination of Elliott-wave analysis with Gann analysis which provided price and time targets based on the prior June 16th bottom. I expect that the next couple days might show prices attempting to stabilize and...

Cryptocurrency rally looks to have temporarily stalled out after a sharp three-week rally. Ethereum has stalled out in its relative performance vs Bitcoin, and for now, Bitcoin is an outperformer over Ethereum and should be favored. Weekly momentum remains negative and Cycle composites start to turn lower in early March into April/May, so given low retail interest and not many inflows, this could limit the larger rally continuing to all-time highs...
