Walking up the mountain gets you farther than running
Key Takeaways
- Bitcoin continues to march higher, eclipsing another key milestone and trading above the 200-day SMA. Ethereum is also higher on the week but has met resistance at $3,300. Attention turns to the 50-day SMA.
- Bitcoin’s recent price run has not been as “hot” as its gains would suggest.
- Price action has been largely supply-driven and recent movement of coins onto exchanges could present short-term risk.
- Crypto and meme stocks are on the move this week, presenting an early sign of a risk-on macro environment.
- Our team has observed an interesting weekly trading pattern that has appeared over the past three weekly trading cycles, that features mid-week selling and price increases into the weekend.
- Bottom Line: The market fundamentals remain consistent, and we continue to buy BTC and ETH into any near-term weakness.
- Emerging Trends: The Metaverse is gaining widespread adoption with corporates like Visa purchasing NFT avatars. We expect future NFT avatars to do an increasingly better job expressing their owners in the Metaverse.
Weekly Market Recap
Bitcoin continued its deliberate march higher this past week, having surpassed $50,000 for the first time since the industry drawdown in May. Ethereum was also higher on the week but met resistance around $3,300. On Sunday afternoon, the market was brimming with confidence, hoping that Bitcoin would reclaim the $1 trillion market cap level (a BTC price of $53,000 would do the trick). But since Monday afternoon, we have witnessed the market seemingly take a breather in what appears to be some spot selling and consolidation.
Last week, we noted that BTC had fallen below its 200-day SMA after breaking through it for the first time in 3 months. We mentioned that it is normal for the spot price to straddle this trading level before breaking out. As demonstrated by the chart below, BTC found some resistance just below the 200-day SMA, and it has since broken out well above this level. As a reminder, according to Tom Lee’s Bitcoin Rule #3, we are buyers of BTC above the 200-day SMA.
We also note that the 50-day SMA is starting to gain some ground on the 200-day. The 50-day SMA and its relation to the 200-day SMA is a popular trading indicator for many, and while we are not reliant on this metric to signal a “buy’” it would be another encouraging sign for Bitcoin.
Last week, with BTC and ETH hovering around $45,000 and $3,000, respectively, we suggested that investors continue to buy into weakness as both on-chain and market data pointed toward a healthy underlying market structure and that we felt some macro tailwinds were on the horizon. Although our tune is similar this week, we will attempt to highlight a few risk factors that we are monitoring closely.
Is BTC too hot right now?
We have fielded repeated questions from clients on whether the Bitcoin market is overheated. This is a reasonable inquiry given that the cryptoasset’s price has experienced a 60% rebound from its low in July. However, we would like to highlight the following charts that speak to the rather methodical and leverage-free march higher that Bitcoin has experienced over the past month.
Below is a chart that features Bitcoin’s price mapped against a ratio of futures open interest over the total exchange balance of BTC. This provides directional guidance for how much leverage is in the market at any given point relative to the total liquid supply of BTC on centralized exchanges. As one would expect, we can identify several points over the past year at which sharp increases in leverage correspond with subsequent sharp movements in price. Such observations give us a sense of the pace at which the market can absorb said leverage, and point to the fact that the current leverage ratio is quite tame and has moved relatively sideways for the past couple of weeks. Should this ratio start to climb higher, at a more rapid pace, we will be on alert for more substantial liquidations in either direction.
Two Sides to Every Price Equation
Price is a function of supply and demand. While we have observed relatively consistent demand from crypto native investors during this latest bull run, the BTC price has received its major boost from the other side of the pricing equation – supply.
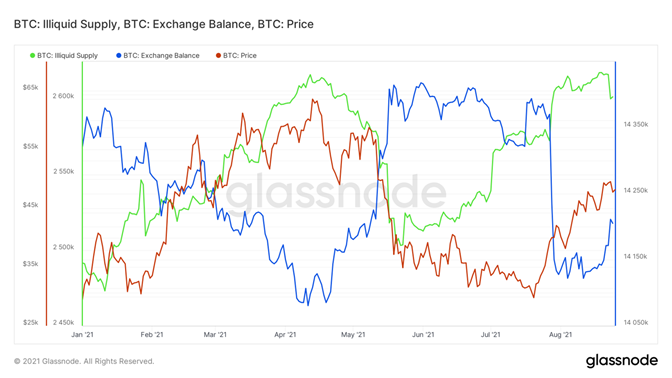
Below is a chart featuring several seemingly random lines, but we will do our best to explain the relationship between all three. The green line represents a metric classified as illiquid supply. Illiquid supply is comprised of coins held by entities that are determined to be “illiquid,” meaning that these coins are unlikely to be moved regardless of price action. The blue line is the aggregate exchange balance, or the number of BTC on centralized exchanges (considered very liquid). Finally, the orange line is the BTC price over the YTD period displayed.
We can observe a positively correlated relationship between the Bitcoin price and illiquid supply, and an inversely correlated relationship between the Bitcoin price and exchange balance. This is a clear representation of a supply-driven market coupled with steady demand. We note that over the past week, the green and blue lines have moved in bearish directions. We do not intend to be too reactive to this, as this chart on a longer timescale features periods where these trends break, but we wanted to get this on our radar as something to observe moving forward. If this trend continues without further clarity on the current macro picture, we may need to adjust our near-term thinking around price movement.
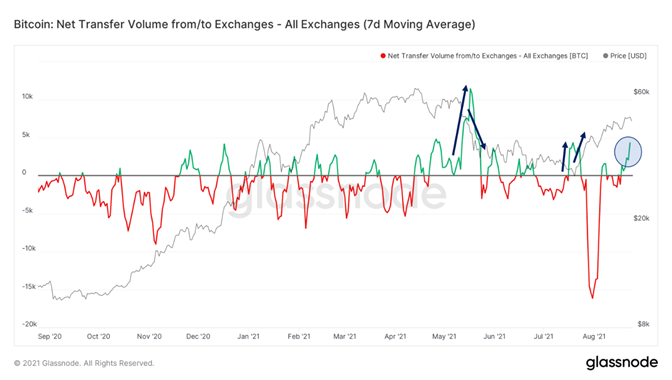
Below is a chart that features BTC flows to and from exchanges. We can think of this chart as an isolated view of the movements in and out of the blue line in the chart above. As previously alluded to, we can see that over the past week, coins have moved out of wallets and onto exchanges (green line). While this is a short-term bearish pattern, we wanted to highlight this chart to express the lack of conviction in this specific metric as we can demonstrate periods over the past 12 months during which positive exchange flows have been met with concurrent price increases. Therefore, while these minor changes in supply dynamics add to the risk profile of the current market structure, these metrics alone should not completely derail our current view on the market.
What do you meme?
While the fundamental attributes of Bitcoin are more aligned with that of a long-term store of value, our clients know that we view Bitcoin’s current status as a risk-on asset. As discussed in previous Crypto Weekly’s we have been waiting for a more refined sense of where the economy will head in the fall. Questions still loom over how quickly reopening will occur and how the fed will position itself around tapering.
We would like to point out that Federal Reserve Chairman Jerome Powell will be streaming his Jackson Hole speech on Friday via Zoom. Investors are eager to hear what Powell has to say regarding easing Fed purchases and his overarching views on the economy. We sense that there will be hesitance to start any tapering in the face of the current positivity rate of the Delta variant.
That said, we think that the macro picture is starting to look friendlier and more closely aligned with a risk-on environment. Data arduously compiled by our macro team demonstrates that while many states are still suffering from high hospitalization rates, there are signs that cases are starting to peak. Once this happens, continued Fed purchases coupled with record levels of institutional cash on the sidelines could spell for a crypto-friendly fall.
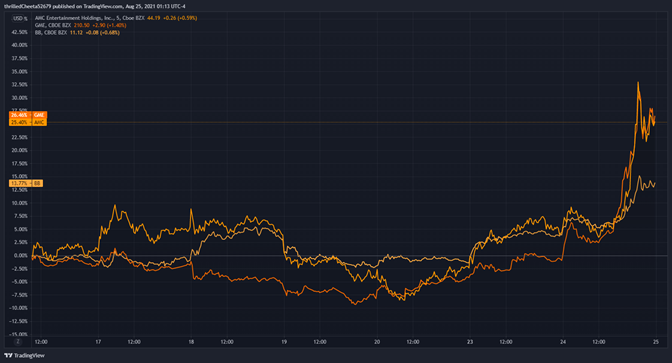
One potential early sign of lowered risk-aversion is positive performance in both crypto and meme stocks. Below are two charts, the first of which features what we would refer to as “meme” stocks. These stocks are characterized by a fervent set of followers that “ape” into and HODL names that have fallen out of fashion among fundamental investors in hopes of triggering price run-ups, short squeezes, and massive gains. We observe that notable meme stocks AMC, GameStop, and Blackberry are all up on the week. The most risk-on investors generally lead the way when the market turns – could this be a sign?
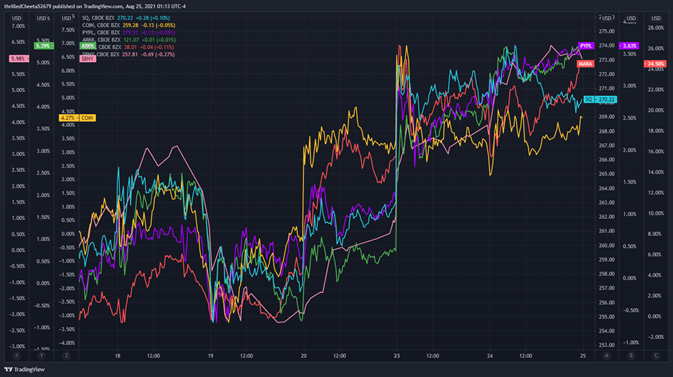
Further, we can see below that crypto equities are having a great week as well. Perhaps this is merely correlative to the underlying crypto price action, but many traditional institutional investors that desire exposure to cryptoassets but do not have access to exchanges seek exposure via crypto equities. Perhaps this is another leading indicator of risk-on appetite in the market.
Where Do we Go From Here?
If it feels like this week rhymes, it is because it does. Below is a chart that displays price action for the prior three weeks. The red line is the BTC price on Monday and Tuesday of this week. This chart should be self-explanatory, but there has been a clear pattern of buying toward the end of the week and profit-taking towards the middle of the week. Needless to say, we try to steer clear of concluding based on charts that form pictures, but this one is staring us right in the face. While we are uncertain what the drivers behind this pattern are, we will look to see if we can once again complete our weekly “smile.”
The Takeaway
In the face of recent resistance faced by BTC at $50,000 and concurrent unnerving on-chain activity, I would classify us as vigilant optimists heading into the next few weeks. To be clear, we will continue to buy BTC and ETH into any weakness in price. The fundamental elements that support our thesis of a bull run into year-end are still intact. Near-term pullbacks and consolidation before overtaking the $50,000 are healthy and sustainable – after all, walking will get you much farther up a mountain than running
Metaverse: Why Visa spent $150,000 on a JPEG
Over the past two weeks, we’ve highlighted two important trends developing in the Metaverse: Gaming and Content. This week we introduce a third: NFTs. As a refresher, we describe the Metaverse as an open virtual economy characterized by ownership rights and social interactions built on the blockchain. The ability to track and prove ownership is something we regularly take for granted in the physical world – especially in the West. If you purchase a new car and park it in your driveway, your ownership of the car is generally understood. In the rare event that someone questions your ownership, you can easily point to the title with your name on it for proof.
In the Web 2.0 era (pre-blockchain), proving ownership of digital goods was nearly impossible. Any picture saved on your computer can be copied and distributed an infinite number of times. Blockchain allows for digital ownership by encapsulating items in digital tokens (tokenizing them) and tracking them on publicly verifiable ledgers. The first and most popular application for digital ownership was store-of-value and monetary assets like Bitcoin. NFTs or Non-Fungible Tokens are some of the newer applications that take advantage of the digital ownership rights provided by the blockchain. Instead of representing homogenous assets like bitcoins or dollars, NFTs are used today to represent unique assets like art and collectibles.
Last week, Visa (V -0.59% ), the credit card company founded in 1958, purchased an NFT for $150,000. Visa’s new NFT is a CryptoPunk – an algorithmically generated image representing a unique digital character. Visa’s CryptoPunk is #7610 – 1 of only 10,000 that will ever be created. Like baseball cards and other collectibles that increase in value with age, CryptoPunks derive much of their value from being one of the earliest Ethereum-based NFT projects (released in June 2017).
While the $150k price tag might seem high, CryptoPunk #7524 sold for an eye-popping $11.7 million at Sotheby’s auction in June, making Visa’s purchase look like a bargain. In fact, since Visa’s purchase, the cheapest Punk available has increased in price to 74.22 ETH or $241,013. Since its inception, the project has totaled $873 million in primary and secondary market sales with $160 million occurring over the past week.
While it’s easy to dismiss CryptoPunks as a speculative frenzy (after all they’re just JPEGs) their success might have less to do with supply/demand and more to do with advertising status and individual identity. In the same way folks wear Louis Vuitton bags or carry Gucci wallets in the physical world as a display of wealth (a proxy for status) – Punk owners flash their NFTs in the virtual world by posting them on social media and using them as profile pictures. While it may seem shallow – indeed, status and wealth are generally low-hanging fruits – this is why Louis Vuitton, Gucci, and CryptoPunks are successful. They effectively convey status and wealth.
But individual identity is much more complex than status alone. Those that are comfortable with their status express their identity through an infinite number of avenues – the people they socialize with, the music they listen to, the food they eat, the places they travel to, the style of clothing they wear, etc. If social media is any indication, avenues for self-expression and identification are in high demand. So, while the sticker price of CryptoPunks indicates status, their unique characteristics are a way for owners to express their identities in the virtual world.
Today, the argument that a Punk’s value is tied to an owner’s desire to express themselves might be a stretch. After all, how much can a 24-pixel by 24-pixel image say about you?
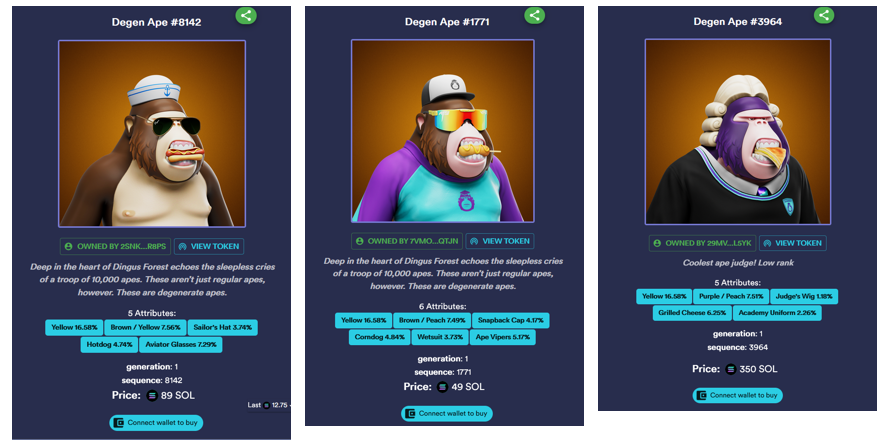
But we’d argue that Punks are just the first wave of supply meeting the demand for new avenues of identity expression. New NFT projects have caught on to this trend and are developing accordingly. For example, Degen Ape Academy is a Solana-based NFT project gaining traction. Each Degen Ape comes with a unique set of “attributes” ranging from hairstyles to sunglasses and clothing – allowing those interested to purchase the Degen Ape with the attributes they wish to express themselves with.
Still not convinced? We don’t blame you. NFT avatar projects are still in the very early innings. Though we expect developers to continue building avatars that do an increasingly better job of expressing their owners in the Metaverse.
Reports you may have missed
MACRO SETUP STILL LOOKS GOOD FOR CRYPTO As discussed last week, we achieved the favorable setup we were anticipating. A combination of (1) a dovish Federal Reserve, (2) an accelerated tapering of quantitative tightening (QT), and (3) a Quarterly Refunding Announcement (QRA) that met investors' expectations contributed to a decline in rates during the first week of May, alongside a rebound in crypto assets. However, crypto investors remain cautious, and...
INFLOWS RESUME On Monday, market sentiments were rattled by a surprisingly strong manufacturing PMI figure, marking the first expansionary reading in 18 months. This led to a rise in rates, with risk assets across the board experiencing selloffs amid renewed inflation concerns and fears that the Federal Reserve might need to implement further measures to cool the economy. However, in our crypto comments video on Tuesday, we outlined a couple...
Adding RON and IMX As a Different Flavor of ETH-beta and Gaming Exposure (Core Strategy Rebalance)
MARKET SHRUGS AT HOT CPI The latest Consumer Price Index (CPI) data indicated a hotter inflationary environment than forecasted for February. Despite the surprise in the numbers, market participants appeared largely unmoved, suggesting that the potential impact had already been factored into their calculations prior to the release. This resilience reflects a broader sentiment that a rates-driven selloff, in response to the CPI figures, is not a significant near-term risk....


