
Golden Cross Approaches and JPEGs Come to Bitcoin

Key Takeaways
- Bitcoin's 50-day SMA is close to crossing the 200-day and may trigger momentum traders to enter the fold. In the past, most instances of a golden cross have resulted in favorable returns for BTC, and many have occurred at critical long-term inflection points.
- An increase in the creation of stablecoins is a positive sign that investors are entering the crypto market and could help maintain the current positive trend in the crypto market. A recent surge in Tether minting is an indication that capital is flowing back into the crypto ecosystem.
- A new protocol called Ordinals allows NFTs to be stored on the Bitcoin blockchain. This development has caused a resurgence in interest in bitcoin development and has led to an increase in average block size as users flock to the network. While there are concerns about the impact of NFTs on Bitcoin's principles and potential node bloat, the non-zero probability of NFTs fueling bitcoin's next bull run cannot be ignored.
- Ethereum is set to launch the Shanghai-Capella upgrade in March after testing in public testnets starting with Zhejiang on February 7th. The increase in recent ETH staking suggests that the amount of ETH locked in the staking contract may actually increase after the Shanghai upgrade.
Golden Cross Approaches
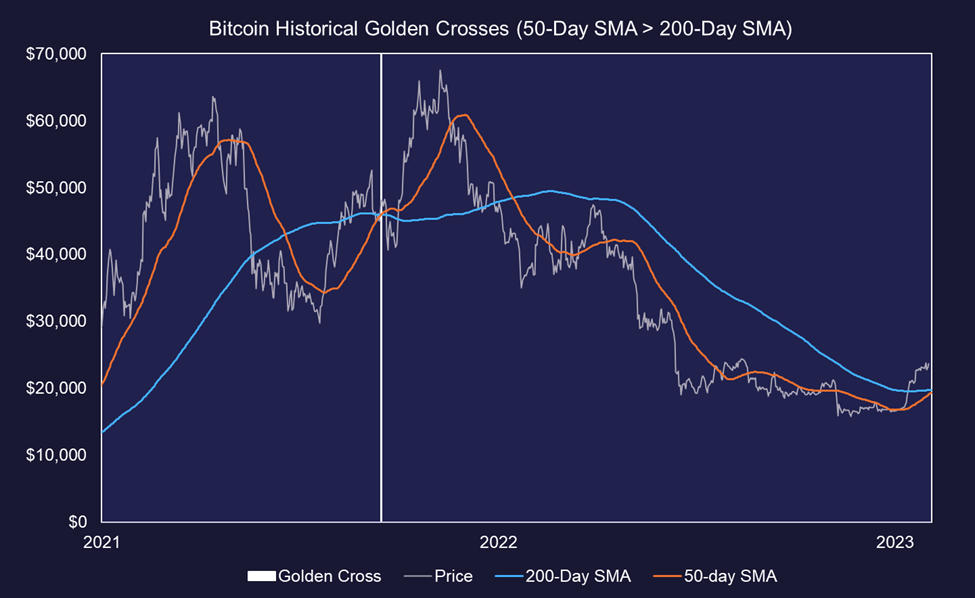
The golden cross is a commonly used technical indicator. It is characterized by the intersection of two moving averages, where a short-term average crosses above a long-term average. The most commonly used moving averages are the 50-day and 200-day. This crossover pattern is widely interpreted as a signal of a potential trend reversal from bearish to bullish, suggesting an upward momentum in the asset’s price.
As demonstrated by the chart below, bitcoin’s 50-day SMA is rapidly approaching the 200-day and is likely to materialize next week, if not over the weekend. This technical indicator may trigger the entrance of momentum traders into the fold.
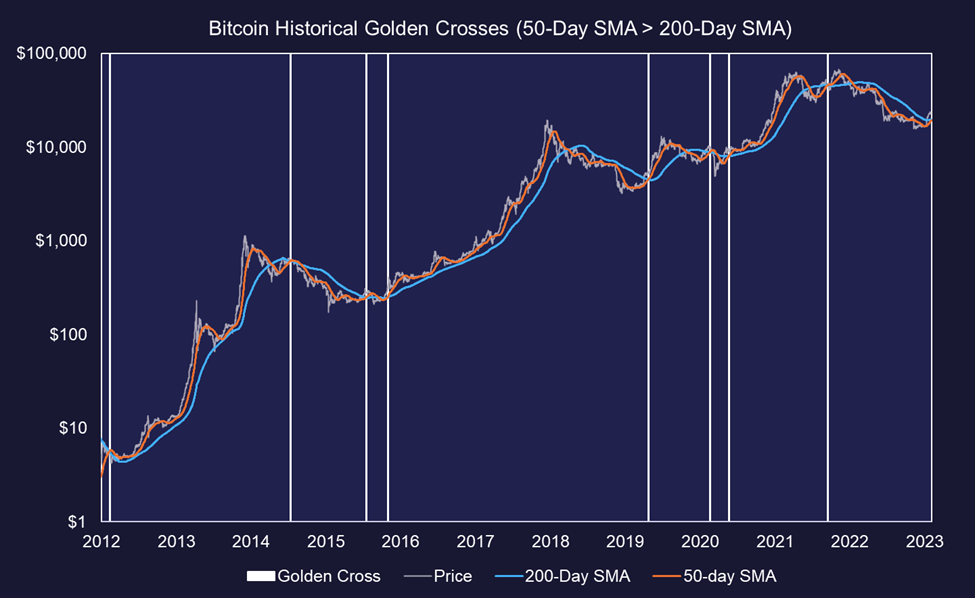
Bitcoin has experienced 8 golden crosses since its inception. We will dig into the numbers below, but visually we can ascertain that most instances of a golden cross have preceded favorable returns across most timeframes. Most occurred at critical long-term inflection points, and only one of these instances would be considered a bearish countersignal.
Below are the historical forward returns across both short and intermediate timeframes. Save for the short-term returns following the Golden Cross leading up to the COVID crash and the longer-term returns following the cross in late 2021, the most recent 5 occurrences have resulted in impressive forward performance.
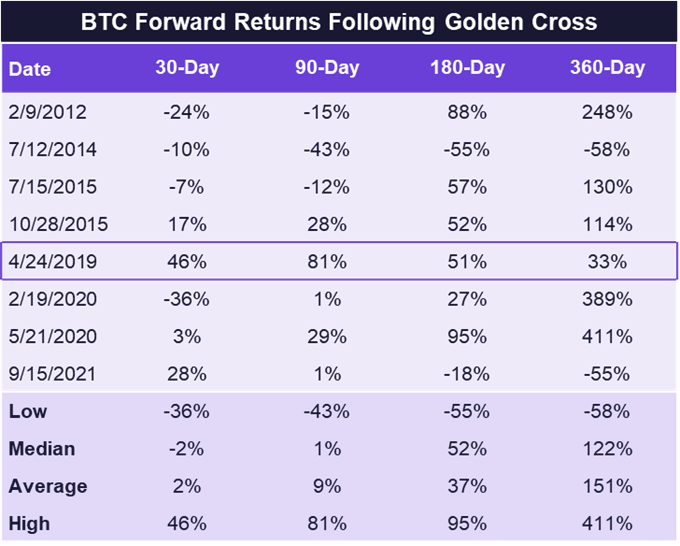
We highlighted the forward returns from 2019 because we found it to be the most appropriate comparison from a cyclical and macroeconomic standpoint. In 2019, we were coming off a Fed pivot in which the Fed eased its hiking cycle and efforts on QT. While we certainly have not witnessed a wholesale Fed pivot, we are seeing inflation start to plummet. The Fed has acknowledged this disinflation in the data, thus suggesting to the market that we are beyond peak tightening conditions.
Further, the golden cross in 2019 occurred just a few months after bitcoin reached its cycle lows, and volatility churned for weeks – very similar to the current setup.
Tether Mints Suggest Market Entrants
As we have discussed in prior notes, major stablecoin market cap changes are important signals of capital flows into and out of the crypto ecosystem. Stablecoins being minted often signifies market participants bridging capital from the “real” economy to invest in, use, or trade cryptoassets. Thus, any significant increase in minting activity is a positive sign that investors are again getting involved in trading activity.
Over the past few weeks, we have observed a significant uptick in Tether mints. Like the increases in realized cap that we highlighted last week, this is a sign that capital is starting to flow back into space and could help preserve the ongoing momentum currently benefiting cryptoassets.
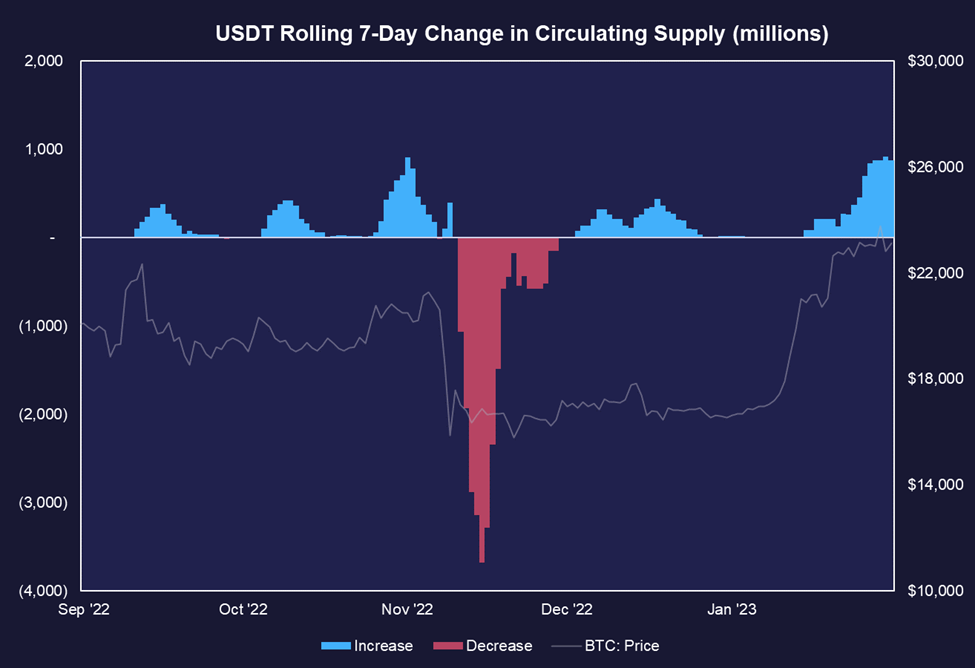
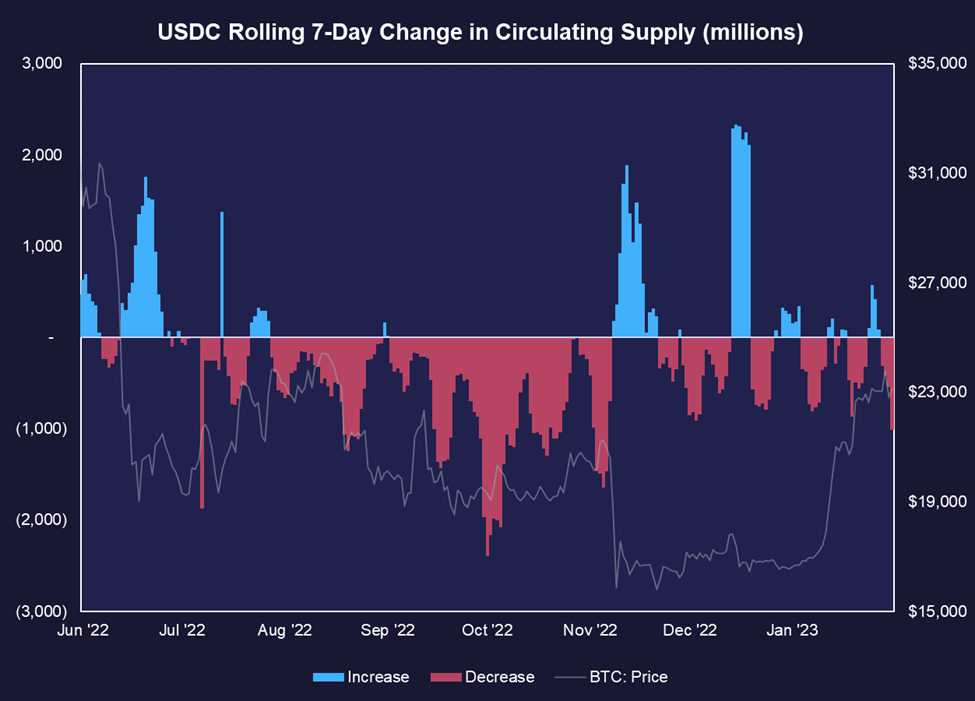
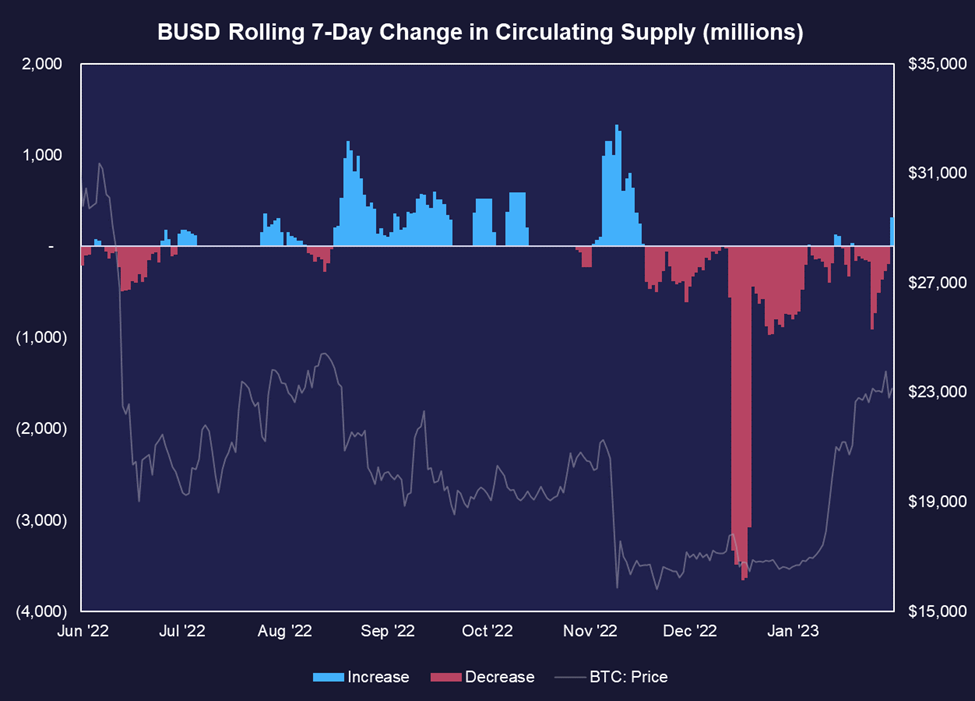
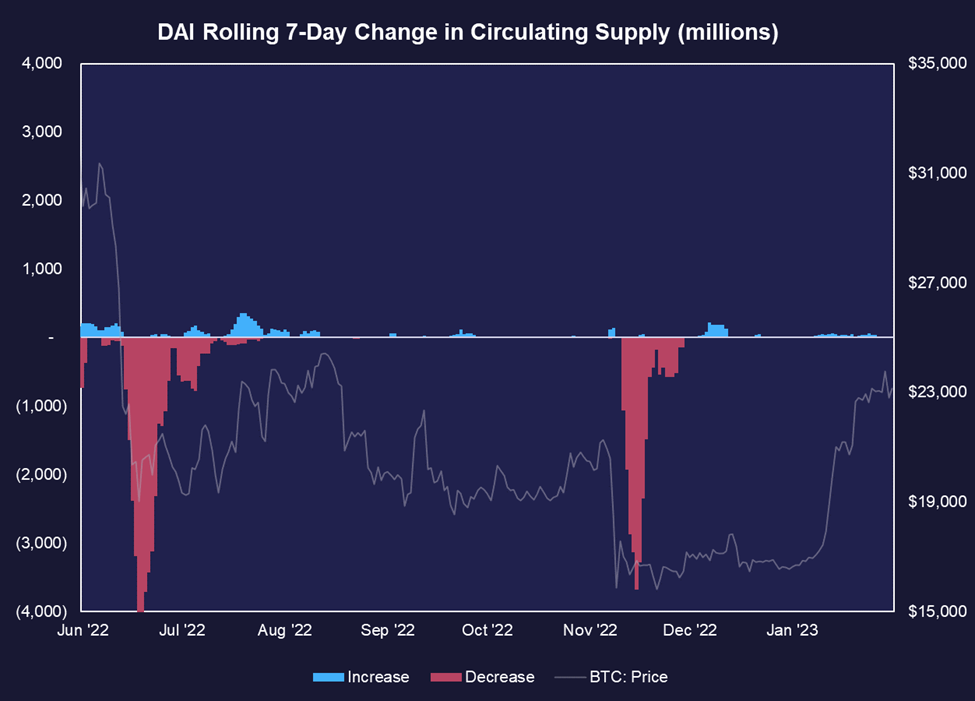
An important caveat to the chart below is that we have yet to see a conclusive trend reversal among the next three largest stablecoins: USDC, DAI, and BUSD.
Dry Powder
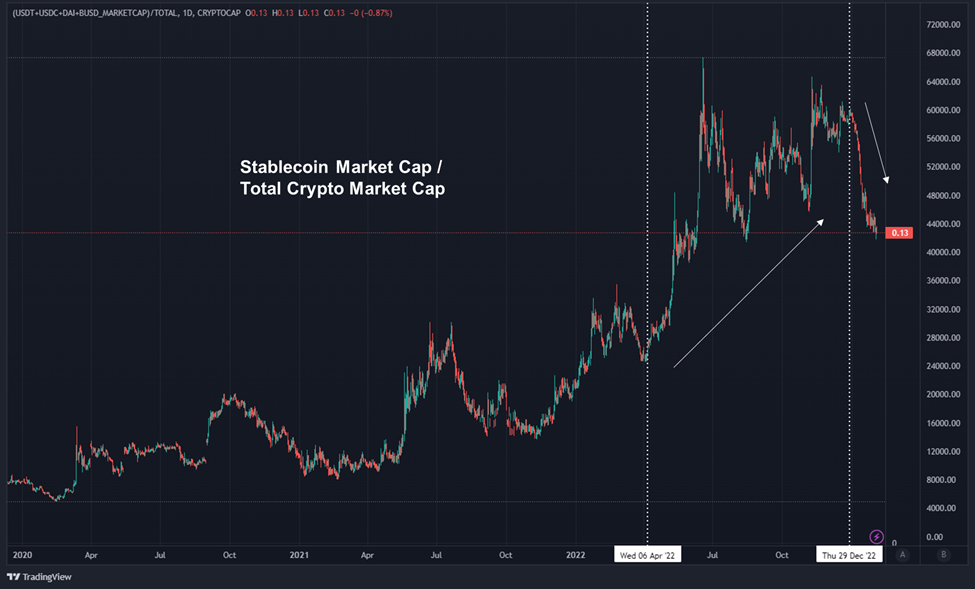
On the topic of stablecoins, one metric that has caught our attention over the past week is the ratio of the aggregate stablecoin market cap (inclusive of USDT, USDC, BUSD, and DAI) to the total crypto market cap. Some refer to this metric as stablecoin dominance.
A good way to view this metric is the relative risk appetite of crypto investors. If the ratio is elevated, it is emblematic of an exodus out of bitcoin, ether, and other risk assets and into dollar-denominated stables.
We can see below that starting in April 2022, a significant portion of the industry ran for the sidelines and stayed parked in stables throughout the remainder of the year. The ratio of the crypto market comprised of the top four stablecoins at one point nearly reached 20%.
Since the start of this year, this ratio has decreased to 13%, well below its all-time high but still quite a way from the bull market range of 5-10%.
Above, we were focused on new capital inflows. However, another tailwind for the recently resurgent crypto prices is the trove of dry powder already parked within the crypto ecosystem and available to be deployed into risk assets.
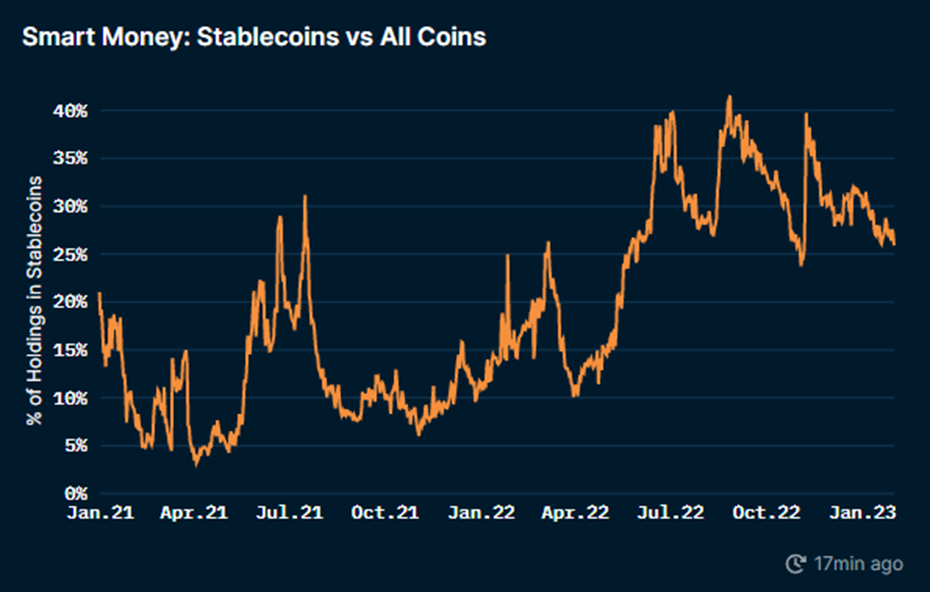
As further evidence that potential buyers are sitting on plenty of dry powder, we can turn to Nansen’s wallet labeling expertise and check to see how much capital owned by wallets designated as “smart money” is comprised of stablecoins.
The chart below demonstrates that over 25% of total smart money holdings are still in stablecoins.
NFTs Come to Bitcoin
Last week, we reduced our Core Strategy stablecoin allocation from 50% to 25% due to emerging macro tailwinds and dissipating idiosyncratic risks. One caveat we noted in our portfolio adjustment was the persistent lack of observable on-chain activity. Not that prices are unable to continue higher without a noticeable uptick in underlying activity. This would merely serve as another provable source of demand for tokens and provides more confidence in the sustainability of any rally.
This week, we are starting to observe an interesting development on-chain with bitcoin, and it may very well signal an unforeseen tailwind for the next bull market.
Below we see that the 7-day moving average for BTC transactions has moved considerably higher. A portion of this move is likely due to on-chain transfers that coincided with the recent rally.
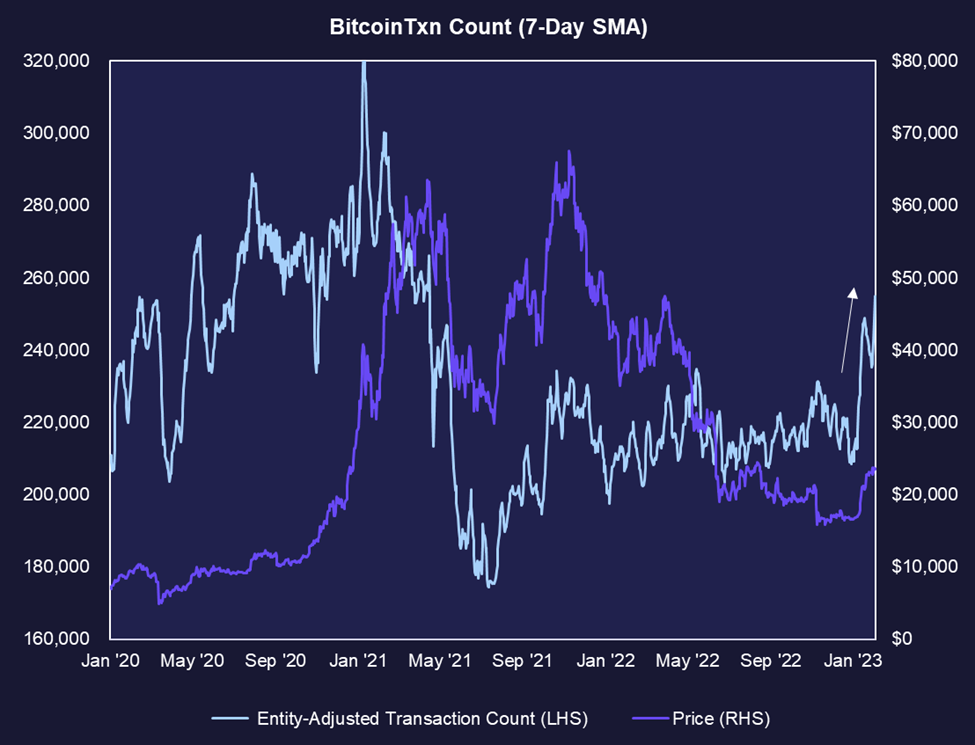
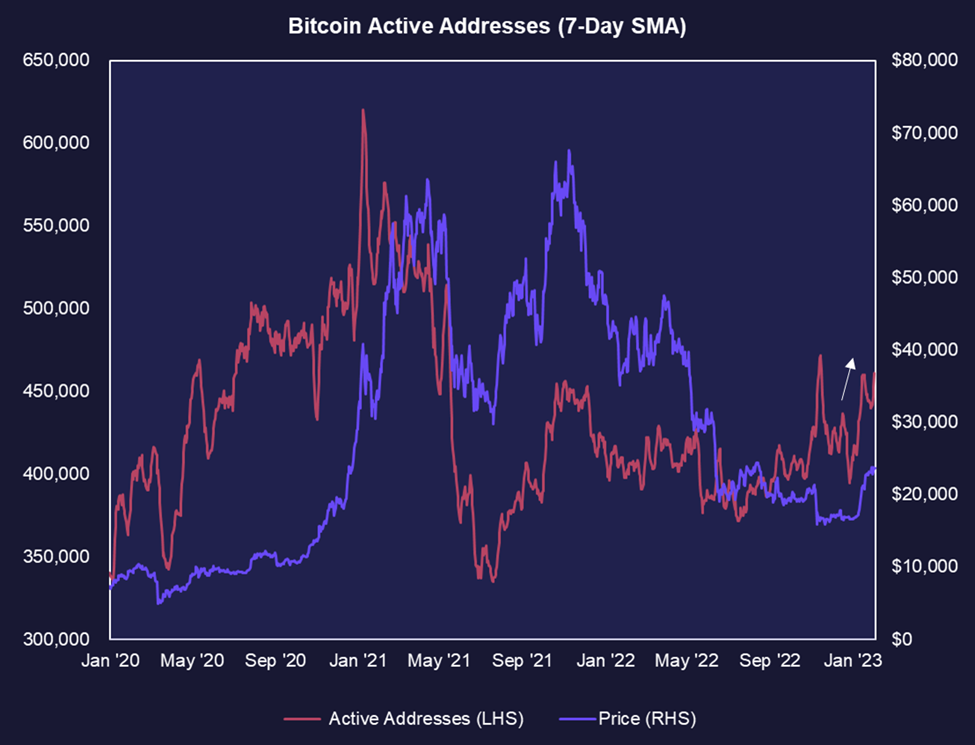
However, one interesting qualitative observation is that the uptick in active addresses is less severe than the increase in transactions. Thus, it might be reasonable to assume that the higher level of transaction activity is due to an existing cohort of addresses using the chain on a repeated basis.
Ordinals: The Next Bull Market Meta?
We think the increase in activity observed above is at least partially attributable to the emergence of NFTs on bitcoin.
Yes, you read that correctly – there are now projects working on instantiating non-fungible pieces of data on the bitcoin blockchain and facilitating their trade.
Ordinals is a new protocol that allows NFTs to be stored on the Bitcoin blockchain. Broadly speaking, it uses a design feature in Taproot to bypass established limits set because of negotiations between those who saw Bitcoin primarily as a financial tool and those who saw it as a data storage solution. Despite the loud critics from the more dogmatic side of the bitcoin ecosystem (some of which have gone as far as advocating for the censorship of transactions by miners), the benefits to the network have become immediately apparent. From an anecdotal perspective, our team has observed a resurgence in interest in bitcoin development since this new project appeared on the industry’s radar. This is a welcome sight for proponents of censorship resistance.
We have also observed immediate benefits to the network since the launch of Ordinals. One burning, and in our view, reasonable, criticism of bitcoin’s current security model is the lack of miner revenue attributable to fees. As it currently stands, the lion’s share of the security budget paid to miners to secure the network comes from the block subsidy. While this is fine while the network is in the bootstrapping phase, bitcoin must either figure out a way to create a sustainable demand for blockspace or hope that non-economic miners commit to securing the network. The latter is certainly possible but less than ideal. Well, the excitement surrounding NFTs on Bitcoin has brought new experimentation to the network, increasing average block sizes overnight, which translates to higher fees per block.
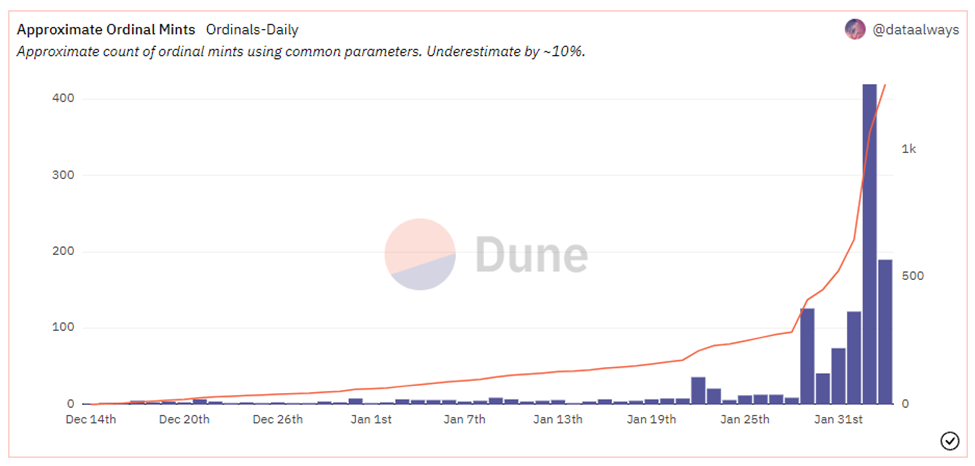
Ordinals were launched a little over a week ago, and immediately, we observed an increase in mean block size as users flocked to the network.
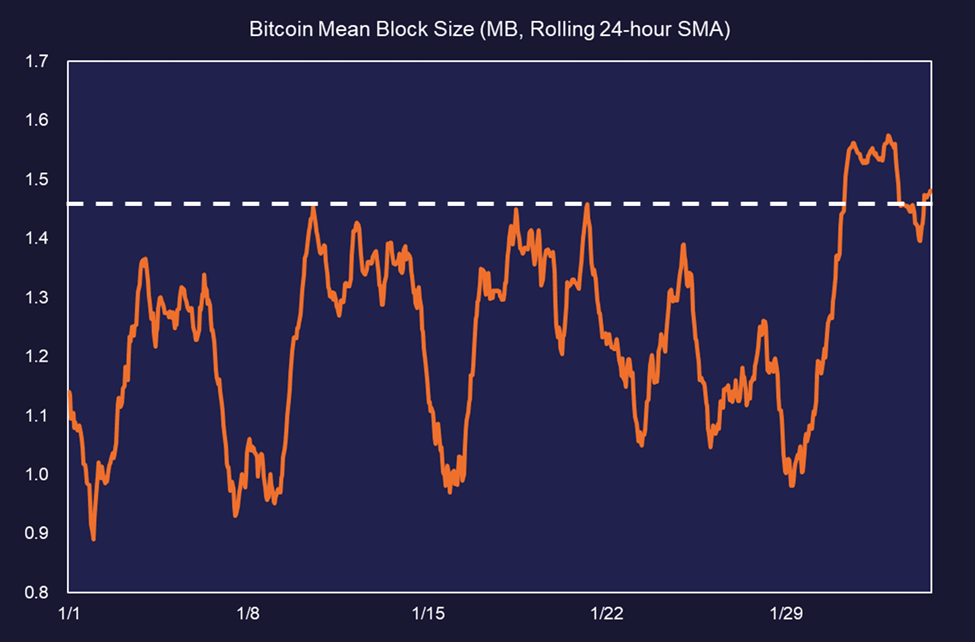
And while the sample size is limited, it is difficult to ignore the relationship between the uptick in average blocksize and the number of ordinals minted over the past week.
What does this mean?
As alluded to above, Ordinals are viewed by some as a threat to Bitcoin because it is a supposed affront to Bitcoin’s principles. There are also concerns that the inscription of non-fungible data on the blockchain could cause node bloat. We are still wrapping our heads around the criticisms of Ordinals, but our initial take is that the concerns seem generally unfounded, and at worst, this will be viewed in retrospect as a non-event. However, the rose-colored view of this development is that NFTs on Bitcoin could be an excellent demand source for blockspace while the asset travels up the adoption curve as money. The potential for NFTs to fuel bitcoin’s next major bull run is a catalyst that few could see happening but is certainly a non-zero probability at this juncture.
Shanghai Preparations
Ethereum is preparing for the Shanghai-Capella upgrade in March (maybe early April) and will activate the Zhejiang public test network on February 7th to test it before the main launch. As our clients are well aware by now, Shanghai-Capella is aimed at allowing the withdrawal of ether (ETH) from network validators, which is currently not possible.
There will be multiple phases of public testing before the final launch in March, starting with Zhejiang. The Zhejiang testnet will be open to the public for testing once activated, and users will be able to run validator nodes and test unstaking of ETH with validators.
After Zhejiang, the Ethereum network team will move on to other public testnets such as Sepolia and Goerli, with Goerli being the final dress rehearsal before the main launch of Shanghai-Capella by the end of March.
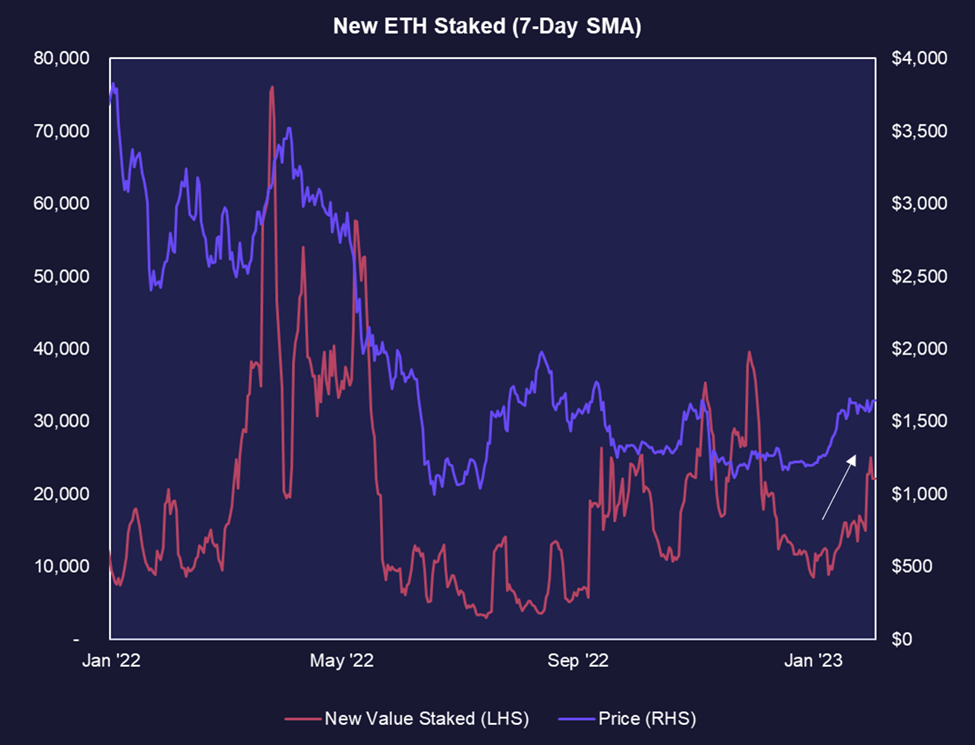
The industry is currently divided on how ETH price will react once unstaking is enabled. We plan to provide a more detailed analysis in the coming weeks, but our high-level view is that the majority of staked ether has had access to liquidity already through liquid staking or exchange delegation. This, coupled with the tiered nature of unstaking should prevent the emergence of selling pressure coming to market overnight. Further, we think it’s plausible that the percent of ETH staked actually increases substantially immediately following Shanghai, as the illiquidity risk incurred by staking decreases.
We think the chart below speaks to this possibility. Despite the “unlocking” of billions of ETH in the matter of a few months, we have seen the rate of ETH staked to the beacon chain increase substantially in recent weeks. Like others who have staked their ETH over the past couple of years, it is likely that the ETH holders who have staked their holdings either have a way to achieve liquidity or simply do not plan to sell in the near term.
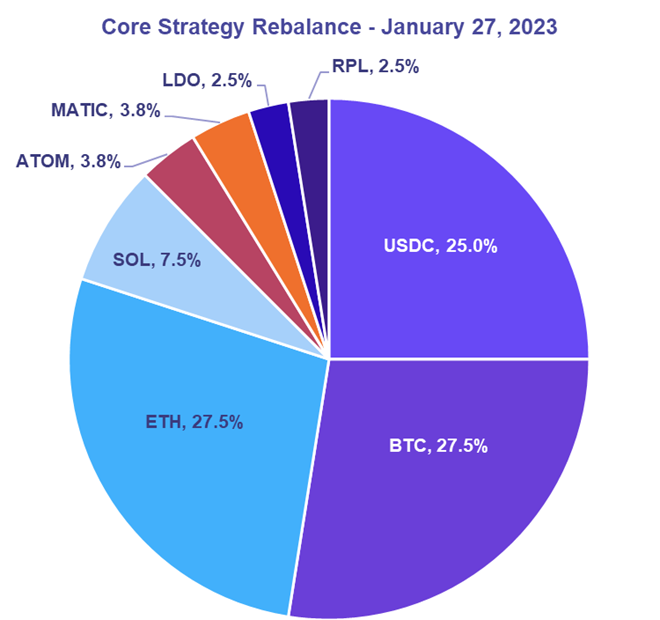
Core Strategy Allocation (Last Rebalance on January 27, 2023)
We think BTC will reach $35k – $44k, and ETH will move to $2,400 – $3,200 at some point this calendar year. Critical narratives we are watching in 2023 include anticipation of the next BTC halvening, the upcoming Shanghai upgrade enabling staking withdrawals, and EIP 4844 leading to increased value accrual at the Ethereum scaling layer. These narratives have informed our allocation to select altcoins.
Reports you may have missed

BUYERS ON STRIKE Last week, we discussed our immediate-term cautious approach to the crypto market, highlighting recent geopolitical tensions, tax-related selling, negative fiscal flows, and the persistent rise in real yields as reasons for a more risk-averse positioning (albeit relative, as holding 7.5% in cash and the rest in crypto is hardly considered risk-averse in most circles). This uncertainty has persisted into this week, evidenced by what we consider an...


Fiscal Dominance, Flows from China, Plus Some Thoughts on Global Conflict (Core Strategy Rebalance)
WHAT BTC SHRUGGING OFF CPI SAYS ABOUT CURRENT FISCAL SITUATION The most significant piece of macro data this week was the CPI. Headline CPI registered at 3.5%, surpassing the anticipated 3.4%, while core CPI remained steady from last month at 3.8%, also above the expected 3.7%. This increase was largely attributed to rising costs in auto insurance and shelter. Consequently, interest rates saw a sharp rise, with the 10-year Treasury...

INFLOWS RESUME On Monday, market sentiments were rattled by a surprisingly strong manufacturing PMI figure, marking the first expansionary reading in 18 months. This led to a rise in rates, with risk assets across the board experiencing selloffs amid renewed inflation concerns and fears that the Federal Reserve might need to implement further measures to cool the economy. However, in our crypto comments video on Tuesday, we outlined a couple...

