The Great Decoupling

Key Takeaways
- Long-term bond yields have surged, reaching multi-decade highs, and the DXY index has remained strong, driven by factors such as robust economic data, the Fed's commitment to higher rates, and increased Treasury financing needs amid reduced international demand.
- Bitcoin continues to display relative outperformance compared to traditional equities amid recent macro turmoil, with correlations suggesting a complete decoupling from key macro indicators.
- This decoupling is likely the result of a combination of factors, including (1) crypto anticipating a short-term peak in interest rates, (2) pre-emptive measures against a potential banking crisis, and (3) Bitcoin's robust price support during Asia-Pacific trading hours, potentially driven by capital flight from mainland China and increased crypto activity in Hong Kong.
- The MakerDAO (MKR) protocol has generated substantial revenue through its Real World Asset (RWA) strategy, primarily from treasury yields. Although recent performance may hint at temporarily overbought conditions, the asset could offer strong investment potential if yields continue to rise.
- Trade Idea – Considering the recent launch of Stars Arena on the Avalanche network, which bears similarities to the rapidly expanding Friend.tech, coupled with the recent significant price correction, we see AVAX as an attractive short-term risk-reward opportunity.
- Core Strategy – Despite soaring rates and volatile asset prices, we believe it’s prudent to adopt a more constructive stance on crypto prices as we start Q4. While we await confirmation from flows data, we think it is right to start increasing risk exposure, particularly in the majors and Grayscale trusts, which continue to trade at a discount to NAV.
What Happens When Bonds Have a High Emissions Schedule
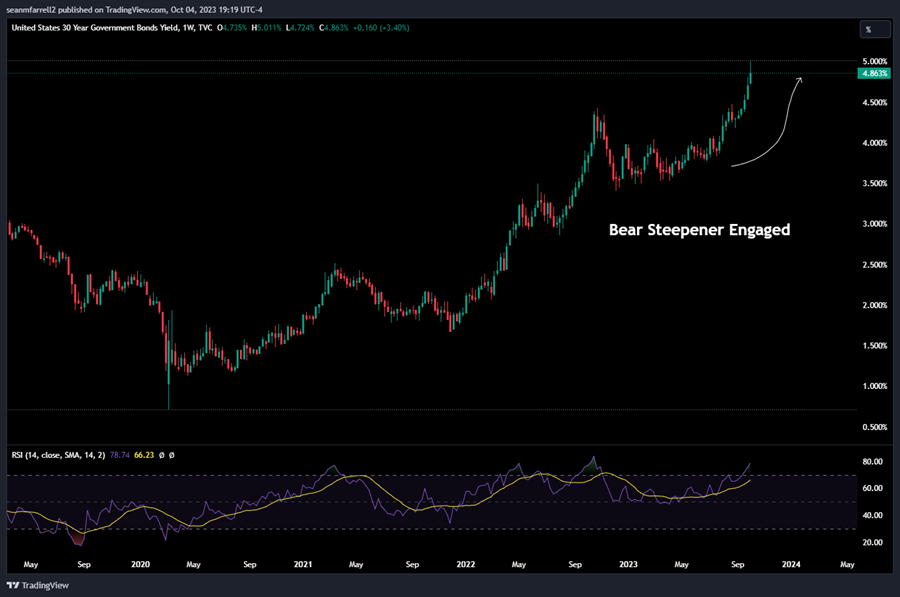
Traditional markets have undeniably faced a whirlwind of volatility over the past week. The bond market continued its recent trajectory with the long end of the yield curve soaring to new multi-decade highs. At one juncture, the 30-year yield even brushed against the 5% mark, a development that has rattled both bond and equity investors.
Concurrently, the DXY index maintained its bullish run. This robust performance is underpinned by a combination of factors: strong domestic economic data, a Federal Reserve seemingly committed to a prolonged period of higher rates, and a growing fiscal deficit that has increased the Treasury’s financing needs in the face of a reduced pool of international debt buyers.
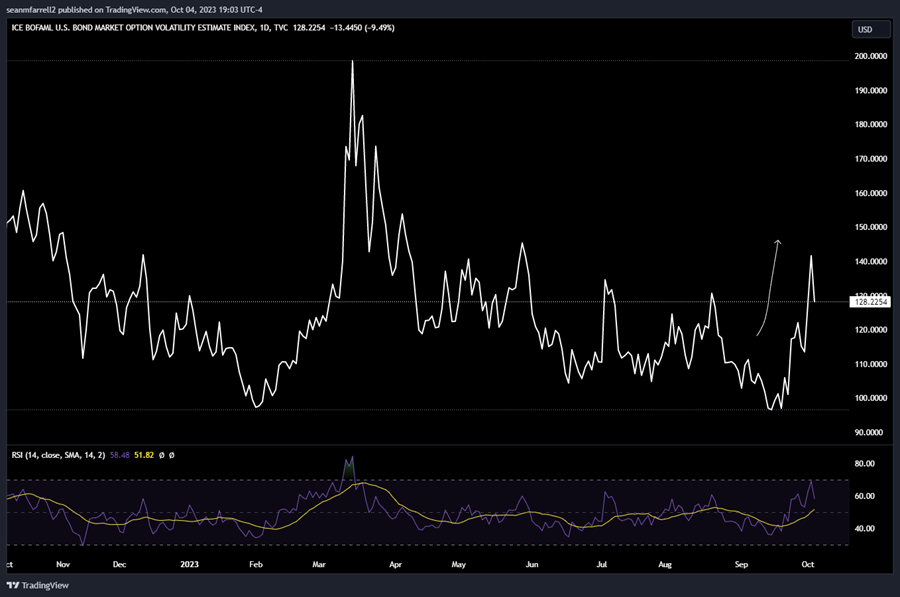
Turning our attention to the MOVE index, a reliable barometer for market lending appetite and overall financial anxiety, we observed a surge past the 140 level for the first time since the SVB winddown. Contrary to the volatility observed in Q1/Q2, which was primarily caused by shifts at the curve’s front end, this time it was the curve’s long end that inflicted the damage. A spike in this key metric often presages challenging times for risk assets, signaling the potential emergence of vulnerabilities within the broader market.
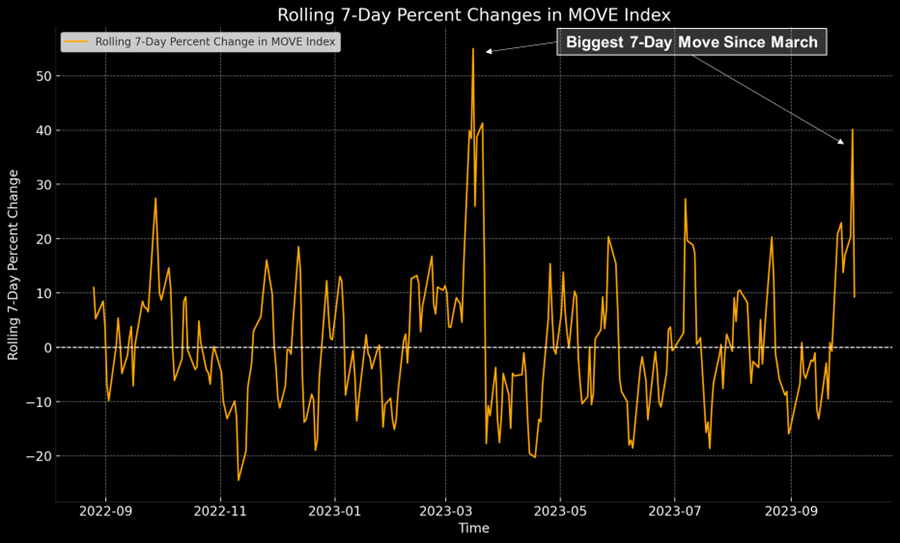
To put this into perspective, let’s examine the rolling 7-day change in bond market volatility. The recent surge marks the most significant change in the MOVE index since March, underscoring the heightened sense of uncertainty that currently pervades the market.
Interestingly, the silver lining amid the macro turmoil has been the resilience of crypto markets, notably Bitcoin. Since mid-September, Bitcoin has displayed a relative outperformance compared to traditional equities.
As illustrated below, the correlation coefficients between Bitcoin and key market indicators such as the Nasdaq 100, gold, and the U.S. dollar have hovered around zero for the past 20 days. Initially, we posited that this decoupling signaled a peak in interest rates, which is likely partially true.
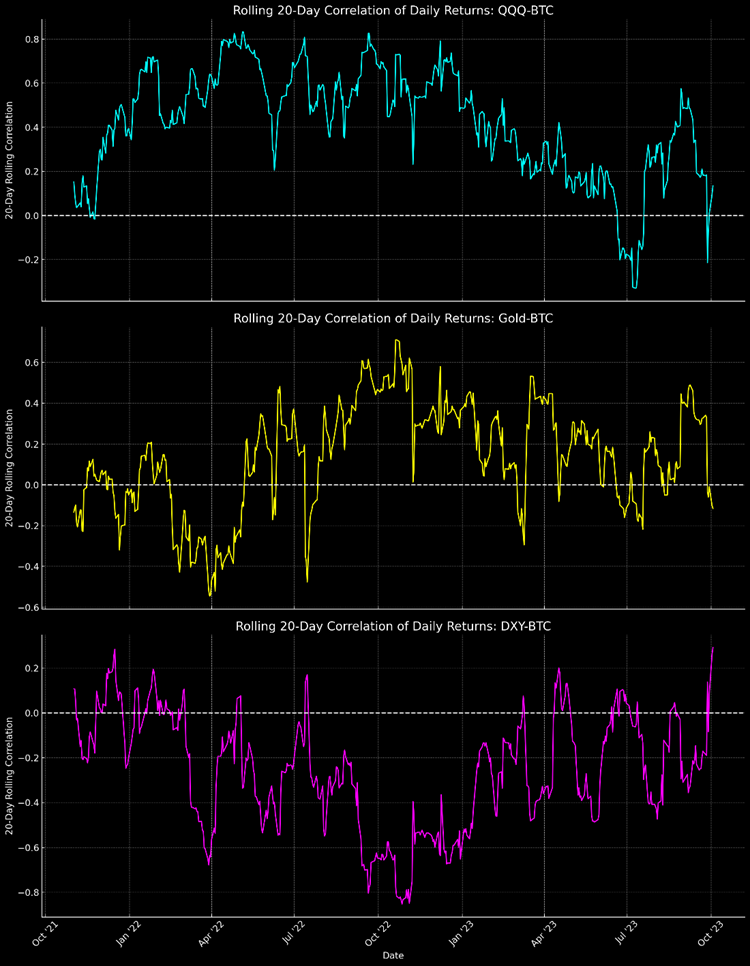
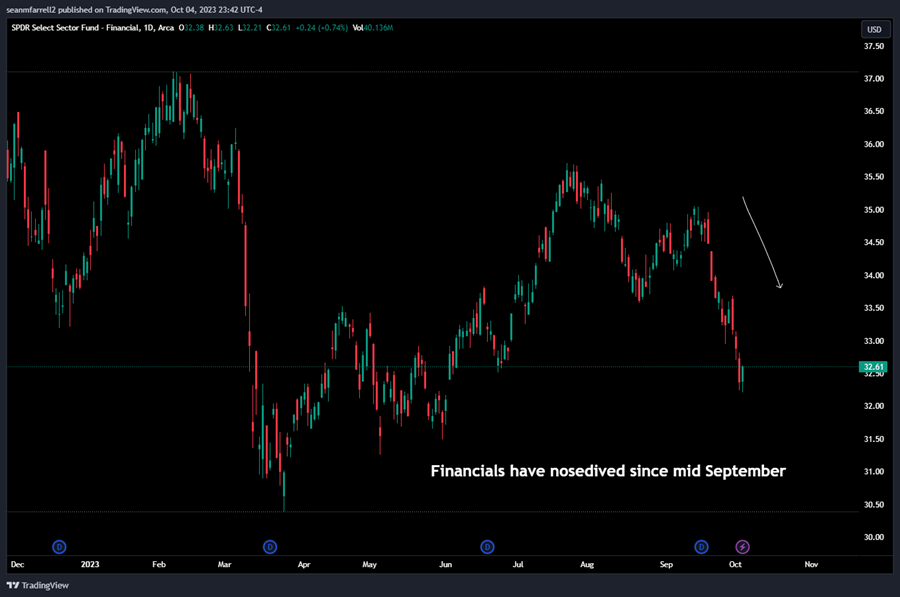
However, there might be additional complexities underlying this decoupling beyond the oversold conditions in the bond market, including the notable downtrend in the financial sector that commenced in mid-September. Taking into account the earlier-mentioned SVB fallout, which resulted in more accommodating liquidity conditions and a subsequent crypto price boost, it’s plausible to envision a scenario where Bitcoin holders hesitate to sell their holdings, potentially in anticipation of an impending banking crisis. This crisis could emanate from assets sensitive to duration, such as Commercial Real Estate (CRE), or an illiquid Treasury market. Assuming the premise that a “breaking point” could favorably impact risk assets, divesting from Bitcoin—already up 4% since the financial sector decline—might appear unwise. This leads to a logical conclusion that (1) if rates remain high and a favorable event occurs, it benefits Bitcoin, and (2) if rates decline, it generally supports asset prices, creating a somewhat asymmetric situation.
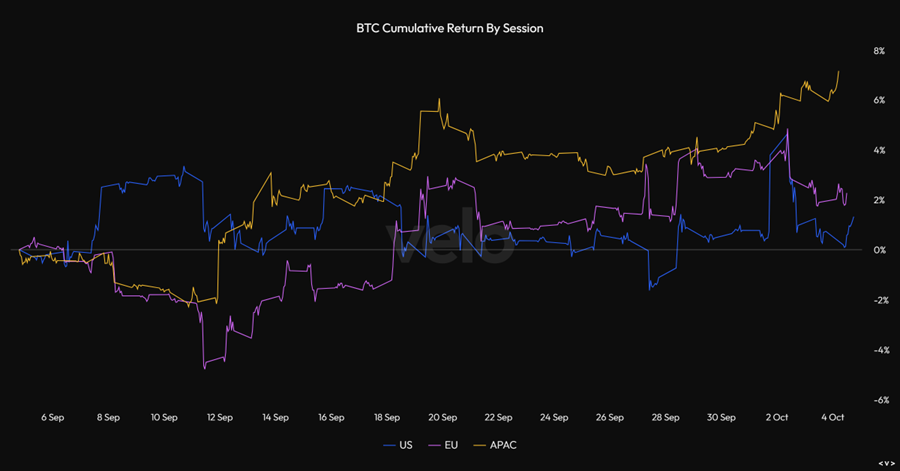
Moreover, the crypto market, particularly Bitcoin, has been showing robust price support during Asia-Pacific (APAC) trading hours. As illustrated below, Bitcoin’s cumulative returns based on regional market hours display a distinct outperformance during Asian hours. Several factors could be contributing to this trend.
First, there is likely a substantial appetite for moving large capital sums out of mainland China, especially against the backdrop of large stimulus coupled with a weakening yuan. Second, Hong Kong’s burgeoning crypto scene has recently opened up, implying tacit approval from mainland China and possibly serving as an outlet for wealthier Chinese citizens to bypass capital controls. Lastly, despite China’s domestic economic stimulus showing limited impact on traditional asset prices, it’s plausible that a significant portion of this stimulus is being channeled into the crypto market.
RWA Meta Emerging
The recent rise in interest rates has provided an opportune moment to discuss an increasingly important application in the crypto universe: the concept of Real-World Assets (RWA) on-chain. This straightforward yet impactful idea involves representing traditional, or “real-world,” assets as data on the blockchain.
Stablecoins like Tether (USDT) and USDC have long been the most prevalent examples of RWAs. These are U.S. dollars represented on the blockchain, maintained at a $1.00 peg through a creation and redemption mechanism. DAI, minted and redeemed by MakerDAO, is another noteworthy stablecoin, particularly within the DeFi space.
Minting DAI in the MakerDAO ecosystem involves locking up collateral assets like ETH or other supported tokens in a smart contract known as a Vault. Once the collateral is locked, you can generate (mint) a certain amount of DAI, which is a stablecoin pegged to the U.S. dollar. The amount of DAI you can mint is determined by the collateral-to-debt ratio set by the system. After minting, the DAI can be freely used or traded. To unlock your collateral, you’ll need to pay back the minted DAI plus any accrued stability fees (interest).
The governance token for MakerDAO is MKR. Tokenholders accrue value through several mechanisms. Firstly, they have governance control, allowing them to vote on key protocol decisions that could maximize returns (not the strongest value accrual mechanism). Secondly, stability fees collected on DAI loans are added to the Surplus Buffer, which can later be used for various benefits like MKR burns. Thirdly, liquidation penalties from under-collateralized debt positions also contribute to the Surplus Buffer. Finally, excess DAI in the Surplus Buffer can be utilized to purchase and burn MKR tokens, reducing the token supply and potentially increasing its value. These combined avenues work in concert to add value to MKR tokens, benefitting their holders.
Extending the RWA Ecosystem: The Case of Treasuries
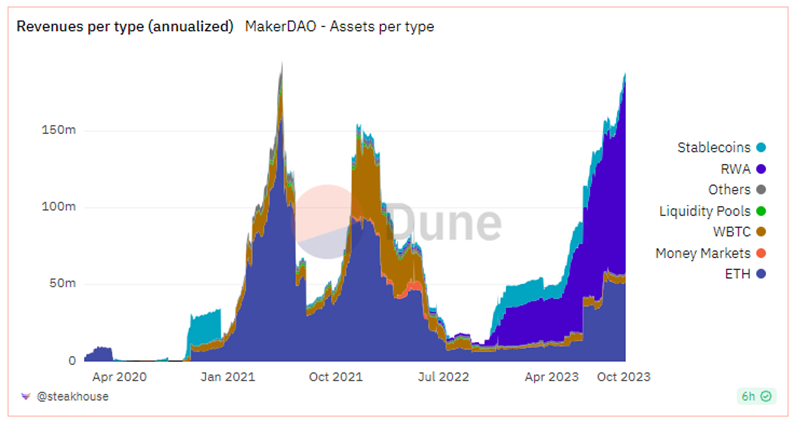
Recently, there has been a concerted effort to extend the RWA concept beyond stablecoins, enabling a global community of on-chain investors to gain exposure to these assets when they otherwise would be unable to (or would require jumping through hoops). A case in point is U.S government treasuries. MakerDAO, an already profitable entity, has proactively engaged with centralized counterparts to bring treasuries on chain. These treasuries, which provide yield upwards of 5% on Maker’s assets, have been a massive windfall for the protocol, having generated over $150 million in annualized 90-day revenue, much of which stems from treasury yields.
This strategy enables MakerDAO to capitalize on high yields while distributing surplus earnings to holders of its governance token through a specialized burning mechanism known as the Smart Burn Engine. Utilizing excess DAI funds, the Smart Burn Engine purchases MKR tokens from the open market. Rather than immediately incinerating these acquired tokens, it pairs them with additional DAI and reintroduces them into the market as liquidity. This innovative approach is designed to enhance both the value and liquidity of MKR tokens over time.
Since the inception of this strategy, the performance of MKR has exhibited a close correlation with interest rates, showing an inverse relationship with bonds.
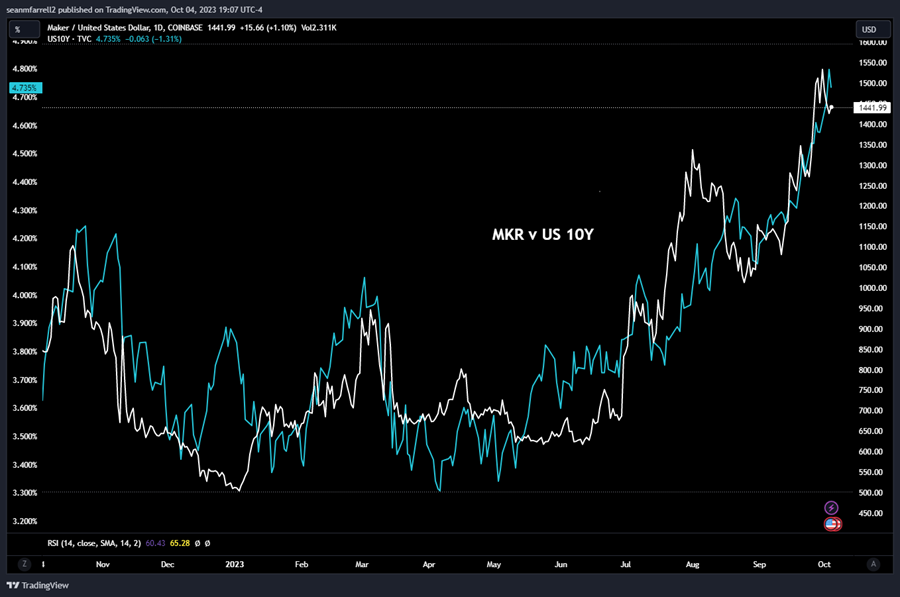
The performance of MakerDAO since the implementation of its Real World Asset (RWA) strategy has been remarkably strong, with the token’s value more than doubling in recent months. While this rapid appreciation might suggest an overheated market—similar to a short bond position—it’s important to consider several key factors that could influence future performance.
- Cyclicality Resistance – First, MakerDAO’s RWA strategy provides a level of resistance to market cycles that is uncommon in other DeFi projects. During bullish market conditions, MakerDAO is well-positioned to see an uptick in demand for its stablecoin, DAI. This is because users are likely to borrow dollars against their crypto assets, bolstering the utility and value of DAI.
- Interest Rate Sensitivity – In a high-interest-rate environment, assuming consistent demand for DAI, both MakerDAO and its governance token, MKR, could benefit from increased yields generated by the treasury. This is a crucial aspect that makes MakerDAO uniquely positioned to capitalize on different market conditions.
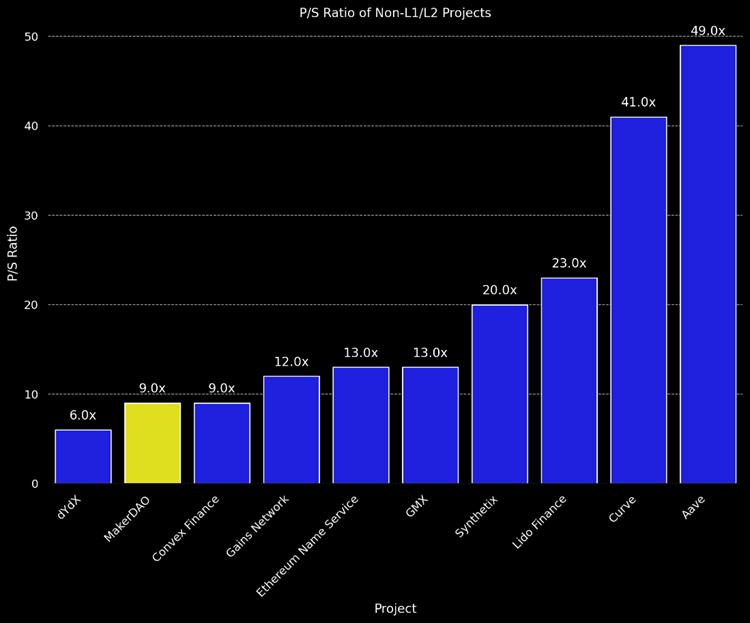
- Relative Undervaluation – Despite its strong performance, MakerDAO remains relatively undervalued when considering the revenue it has generated. This suggests that there is still room for growth, making it a potentially attractive investment opportunity.
However, being long MKR is not a risk-free proposition. One potential concern is MakerDAO’s complexity and its ambitious, sometimes convoluted, vision. There have also been murmurs within the Maker community about centralized governance structures. Additionally, the stablecoin supply has been on a downward trajectory since the peak of the bull market. This contraction presents a risk that, despite potentially higher earnings on treasury assets, the overall asset base could diminish. There is also a minor tail risk associated with the fact that USDC, which constitutes a significant portion of MakerDAO collateral, could face some form of compromise, although we view this as a less likely scenario.
From a trading standpoint, this evolving landscape is crucial to monitor. We anticipate that other stablecoin projects may follow MakerDAO’s lead. FRAX, for instance, is already in discussions about a similar approach, although it remains to be seen whether their methods will have the same effect.
Our forthcoming report on RWAs will delve into this subject further, but it’s worth noting that the mere act of bringing RWAs onto the blockchain will only add value if it either augments an existing, market-validated use case, like DAI, or significantly reduces friction and broadens asset availability. For example, simply tokenizing treasuries for U.S.-qualified investors is unlikely to make a lasting impact unless it meets these criteria.
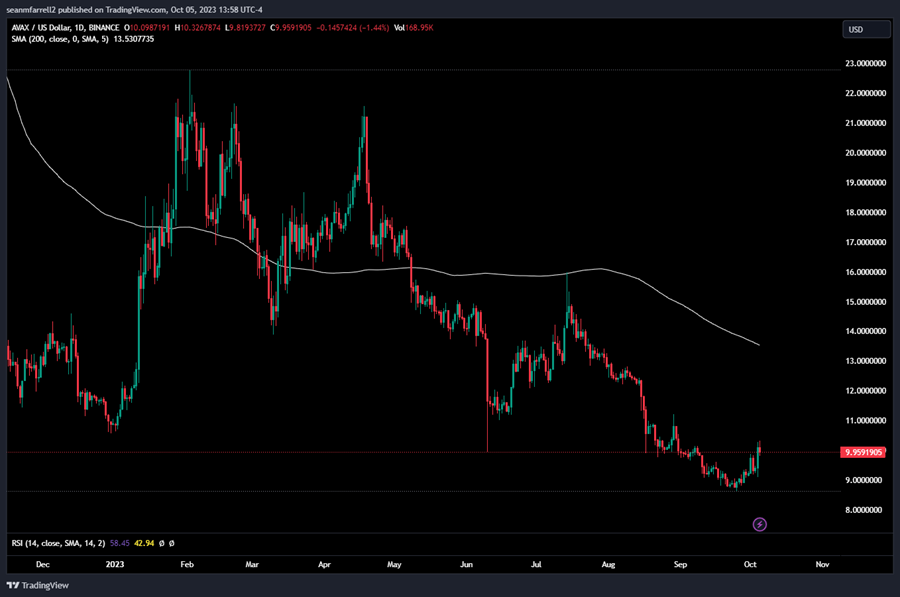
Trade Idea: AVAX Could Benefit From Increased SocialFi Traction
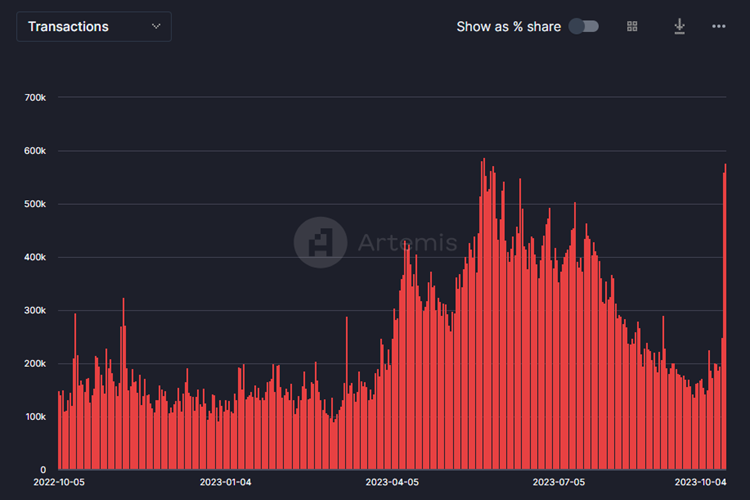
We are closely monitoring the price action of AVAX, which has shown signs of rebounding after a steep decline from $17 just a few months ago. Stars Arena, a platform akin to the SocialFi app Friend.tech (built on Base), has recently launched and triggered a surge in transactions on the Avalanche network. Given the significant price drop in recent months and this emerging catalyst, we view this as a favorable short-term risk/reward opportunity.
Friend.tech (FT) is a decentralized social media platform that empowers users, including influencers and content creators, to monetize their online communities using blockchain technology. Integrated with Twitter and built on the Base network, the platform enables users to buy and sell “keys,” granting access to private in-app chat rooms and exclusive content. Within just two weeks of its launch, FT rapidly amassed over 100,000 users and approximately $25 million in earnings.
Users benefit from fees each time keys to their private chats are bought or sold, and the price of these keys can appreciate as a user’s network expands. Although FT has enjoyed early success, it has faced scrutiny regarding its sustainability, potential for market manipulation, and absence of a long-term vision. Nonetheless, it has certainly captivated the attention of the crypto community and increased activity on Base.

Stars Arena adopts a similar model but leverages AVAX as the token within the app. Additionally, anecdotal reviews suggest that Stars Arena offers a more polished UI/UX compared to FT.
Unfortunately, there’s no existing precedent to assess how the success of a social app like FT would impact the native token price of the underlying blockchain, particularly since Base does not have a native token. However, it’s plausible to assume that if Base did have a token, its price would have surged during this period of rapid platform growth. Taking this into account alongside the recent price correction of AVAX, we perceive it as a favorable tactical risk-reward opportunity.
Core Strategy
Despite soaring rates and volatile asset prices, we believe it’s prudent to adopt a more constructive stance on crypto prices as we start Q4. While we await confirmation from flows data, we think it is right to start increasing risk exposure, particularly in the majors and Grayscale trusts, which continue to trade at a discount to NAV.
We also found that some might benefit from us listing a brief summary of our theses behind each component of the Core Strategy. We will include in our strategy notes going forward:
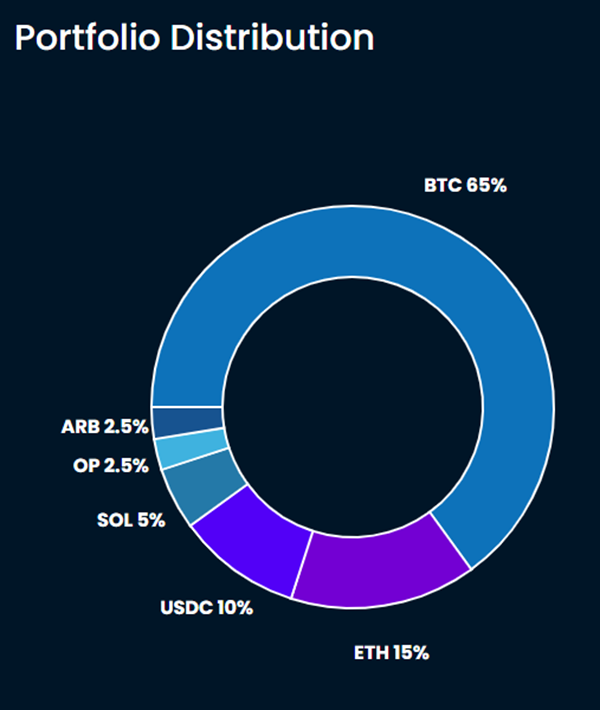
- Bitcoin (BTC 0.84% ): Censorship-resistant money that serves as a liquidity sink in developed markets and base layer money in the global south. It is provably decentralized and can be used to build out a more robust, green energy grid throughout the globe. Potential catalysts include Grayscale vs. SEC, Spot ETF, the halving (April 2024), potential nation-state adoption.
- Ethereum (ETH 0.98% ): Distributed internet architecture whose proven use cases include the distribution of fiat currencies on global rails and a venue through which one can exchange digital assets globally in a permissionless fashion. Potential to supplant rent-seeking intermediaries via immutable smart contracts and digital ownership rights. Key catalysts include Futures ETF, Grayscale vs. SEC, bitcoin halving (indirect catalyst).
- Solana (SOL): The monolithic competitor to Ethereum’s layered strategy. High throughput L1 relying on the eventual reduction in hardware costs to scale. Goal is to be a global shared state operating at the speed of light. A hated token due to affiliation with SBF but has proven resilient.
- Optimism (OP) & Arbitrum (ARB 0.39% ): As ETH looks to scale in layers, more applications and users will migrate to layer 2 networks. The two leaders in this arena with publicly traded tokens are poised to outperform as we near EIP 4844.
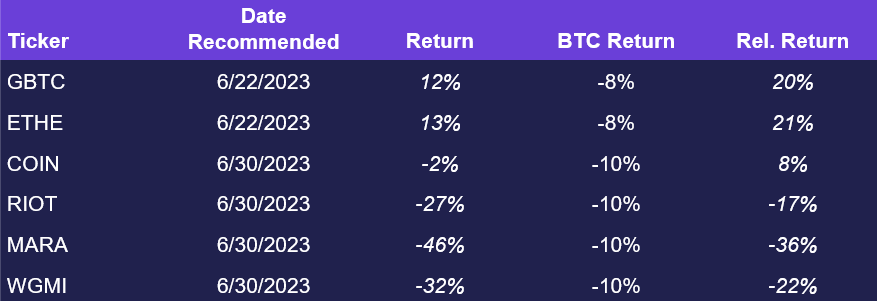
Crypto Equities
Returns through 10/4