Flippening Watch
Key Takeaways
- Perhaps the most consequential CPI print in the metric’s entire history surprised to the downside this week, furthering the ongoing rally for risk assets.
- The final dress rehearsal for the Merge also took place this week, providing us with a revised timeline for the Main Event.
- We revisit the changing supply dynamics post-Merge and provide an example quantifying the net effects on capital flows.
- We posit that ETH surpassing BTC in market cap over the next 12 months is a real possibility.
- Market data continues to look more constructive for ETH than BTC, as ETH options volumes “flip” BTC and miners continue to sell into market strength.
- Strategy – We continue to be long BTC -0.93% , ETH -1.03% , and SOL into year-end and think that Merge-adjacent names, including LDO, RPL, OP, and MATIC, still present attractive opportunities for high-beta exposure into the Merge. Long and medium-term investors should look to use any dips as buying opportunities. The recent rally, coupled with prevailing market narratives and miner dynamics, suggests it might be wise to be overweight large cap altcoins in the medium term.
Inflation Eases, Markets Rip
The collective world briefly exhaled this week as inflation showed its first signs of cooling in nearly a year. On Wednesday, CPI surprised to the downside, as energy prices showed a month-over-month (MoM) decline for the first time since April.
Topline CPI was 8.5%, below the consensus forecast of 8.7%, and lower than the 9.1% figure in June. The CPI basket was unchanged MoM, as the total energy basket came in 7.6% lower than June, while food continued to climb (up 1%) and prices for all items less food and energy were 0.3% more expensive over the same period.
This downside surprise furthered a red-hot risk-on rally in both traditional and crypto markets.
Interestingly, despite all the talk about energy being the only constructive figure in the granular breakdown of the CPI basket, we have actually seen CPI less food and energy slow considerably – this being the 4th consecutive month of decline in YoY rate increases.
The market has since pivoted slightly to a slightly dovish stance following the print, skewing towards a 50-bps hike in September, compared to the 75-bps rate hike being priced in just last week.
Countdown to Mainnet Merge
In the crypto world, the big news this week was the completion of the final testnet Merge for Ethereum, setting the stage for the Main Event.
The Goerli testnet merge went live on Wednesday, and the Ethereum core developers met on Thursday to pin down an estimated window for the Mainnet Merge.
Since the timing of network upgrades is based on block time and not calendar time, target dates are always somewhat fluid, but as of now, the best estimate places Mainnet Merge on September 15-16th.
Merge Timeline Updated with Macro Considerations
By now, you are probably intimately familiar with our Merge timeline that we have periodically updated over the past year. With the three testnet merges complete, Mainnet is all that remains.
With that in mind, we would like to introduce the slightly revised timeline below, which incorporates the major macro events leading up to and directly following the currently scheduled Merge date.
While the Merge is a technical update and should present idiosyncratic upside regardless of the macro landscape, how we think about putting on and hedging risk into and post-Merge could be affected by these macro events.
The excellent news is that the next CPI print will be released a mere two days before the Merge, at which point we expect a lot of pre-event momentum to be baked into the market. Additionally, the next FOMC meeting, when Fed Chair Powell will next wave his magic wand to decide the cost of money, will not take place until AFTER the Merge, meaning this is likely a hill we will need to climb after Ethereum makes the shift to PoS.
Reminder of Why the Merge Matters
Death, taxes, and controversy surrounding just how necessary the Merge is for the network’s health are three things that have been and might continue to be omnipresent in life.
There are widespread misconceptions that a PoS network will enable Ethereum to scale better. This is false, as Ethereum will continue to be relatively expensive at the base layer. At a high level, Ethereum is interested in scaling modularly, so even if the Merge did theoretically increase throughput or quickened transaction finality, this point would be somewhat moot in the grand scheme of things.
The primary purpose of the Merge is to decrease the network’s energy consumption by 99.9% and to allow more users (as opposed to specialized miners) to contribute to block production.
That said, as investors, we really care about how this update could affect price. Thus, we would like to revisit the changing supply dynamics post-Merge and quantify how the Merge changes Ethereum’s fund flow landscape.
Changing Supply Dynamics
From a fundamentals perspective, if the Merge occurs as planned, the effects on the network will be a (1) reduced issuance rate and (2) an immediate reduction in daily selling pressure.
To elaborate on the points above:
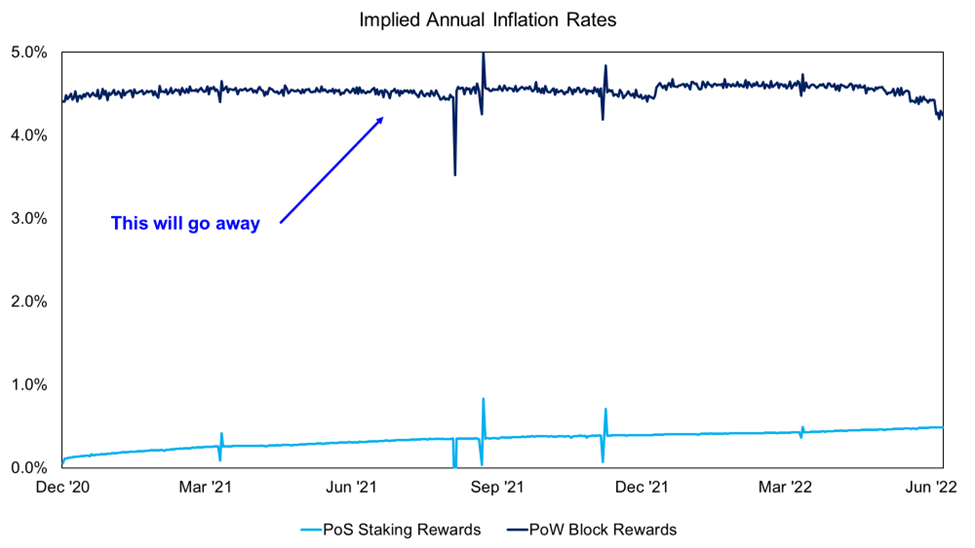
- Reduced Issuance Rate – the inflation rate of supply will decline. At a high level, this is because the block reward required to incent PoW miners is substantially higher (due to hardware costs) than the compensation needed to incentivize PoS miners. Presently, both PoW miners and ETH stakers (who are not producing blocks) are receiving new ETH on every block produced. Once the Merge is complete, the dark blue line in the chart below will no longer be around, and the only source of inflation will be the light blue line at the bottom. Note that these annual issuance rates do not include any fees burned, which could very well result in deflationary supply dynamics.
- Reduced Selling Pressure – this concept dovetails with the point above. If the starting point for revenue available for miners to sell is lower, then inherently, the overall sell pressure from miners will decline. But additionally, one must consider the change in cost profile for miners. The maintenance and energy costs that force miners to sell their ETH for working capital are significantly reduced in a PoS model. Further, there is a short-term consideration that we think is perhaps the most bullish element of the merge – those who stake their ETH before the Merge will be unable to unlock their ETH for at least six months post-Merge. This means that once the transition is complete, selling pressure from miners will be locked at zero.
Quantifying the Reduction in Sell Pressure
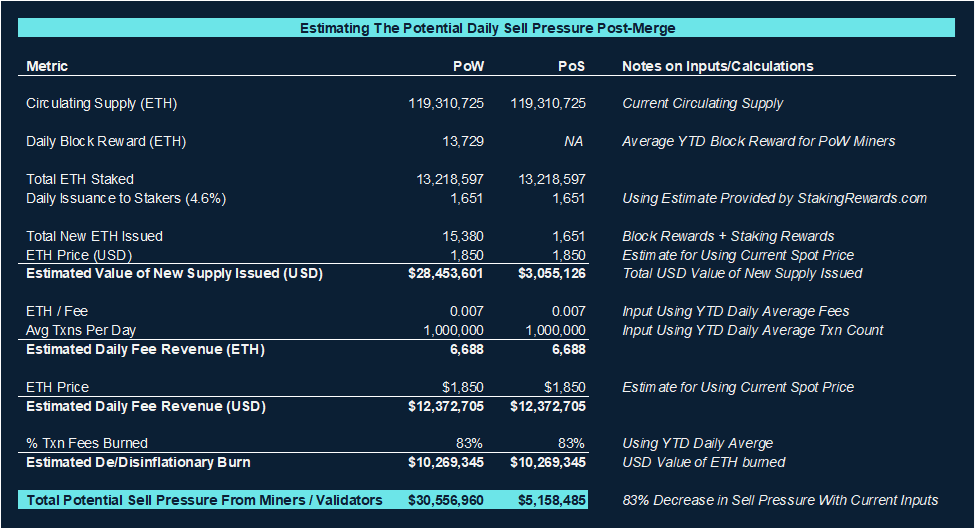
Below we model out the points outlined above. The example below is quite conservative as it assumes that all block rewards and fees incurred by miners/validators are sold immediately. The reality is that PoS validators are likely to only part ways with a small portion of their staking rewards, thus periodically resulting in deflationary supply dynamics.
Applying the inputs below, we can reasonably assume a potential 83% reduction in selling pressure following the Merge.
Again, as we mentioned above, although our example shows approximately $5.2 million in net sell pressure per day, one must remember that until developers push the Shanghai Upgrade, staked ETH cannot be withdrawn. Current timing estimates for the Shanghai Upgrade are 6-12 months post Merge.
To be clear, this means that the selling pressure from staked ETH immediately post-Merge is zero.
While we could undoubtedly witness some secondary market selling pressure from market participants de-risking post-Merge completion, as the network settles, we think the flow imbalances from a deflationary supply have the potential to be incredibly constructive for price.
Flippening Watch
With the Merge approaching and Bitcoin continuing to underperform, we are officially on Flippening Watch. While we still think there are inherent technical risks embedded in the Merge that we will continue to assess leading up to the big event, we believe that from both a narrative and fundamentals perspective, Ethereum now has a good chance of surpassing Bitcoin in market cap over the next 12 months.
It will be an enormous feat, and the second-largest asset still has a considerable way to go, but we think this outcome must be considered a real possibility.
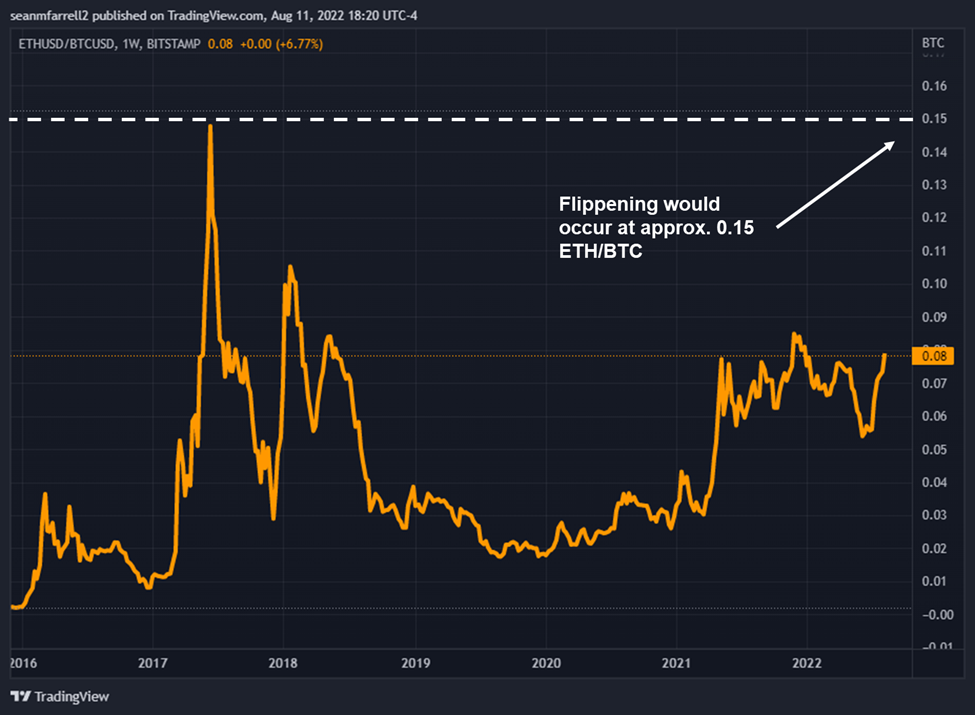
Below we can see the ETH/BTC chart is currently at its highest level since the market downturn, hovering around 0.08 ETH/BTC. At current circulating supply levels, a Flippening at the market cap level would transpire at approximately 0.15, meaning that ETH gains would need to outpace bitcoin’s by 4x (for example, an ETH price of $5.7k would flip BTC if it stayed put at around $36k, these are increases of 200% and 50%, respectively).
A Flippening in the Derivatives Market
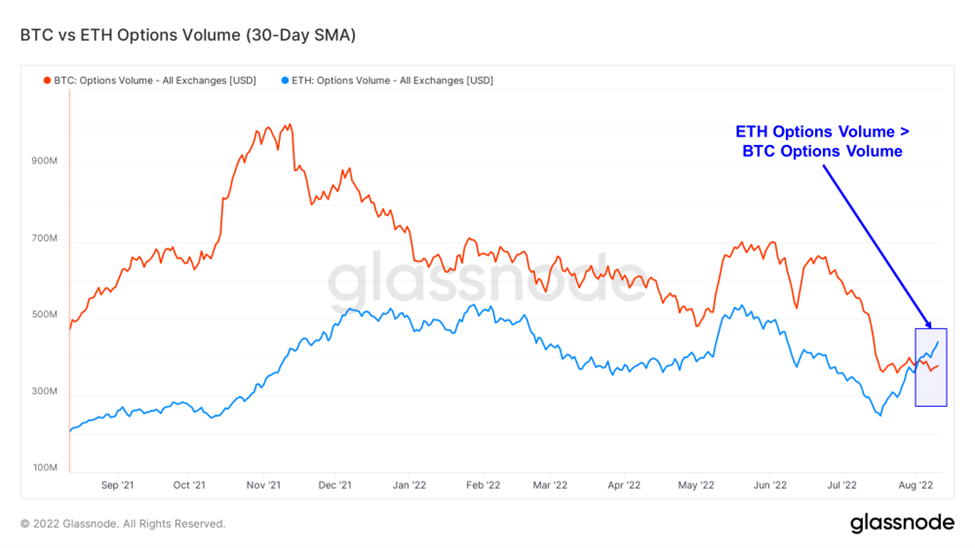
On the topic of Flippenings, interestingly, we have seen ETH options volumes surpass BTC for the first time in history. Below we see the 30-day moving average for ETH options volumes has eclipsed BTC options volumes. This demonstrates a comparatively greater level of attention being paid to the ETH market among traders.
Signs of Risk-on Behavior Increasing
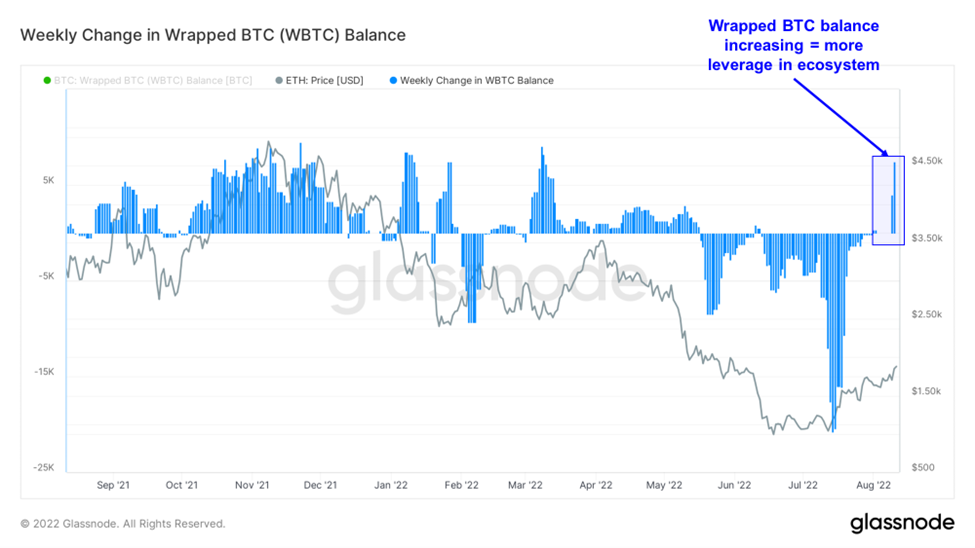
Beyond increased derivatives volumes, we also speculate that crypto-native investors may start putting on more risk. Below, we see that the overall balance of wrapped bitcoin (WBTC) has increased for the first time in several months.
As you may be aware, WBTC is the ERC-20 derivative token that can always be redeemed for 1 BTC. It is commonly used by traders as collateral in DeFi on Ethereum. Last week, we highlighted an increase in stablecoin velocity, which indicates increased on-chain activity. We would posit that the WBTC chart below corroborates this theory.
ETH Holders Still Showing Confidence
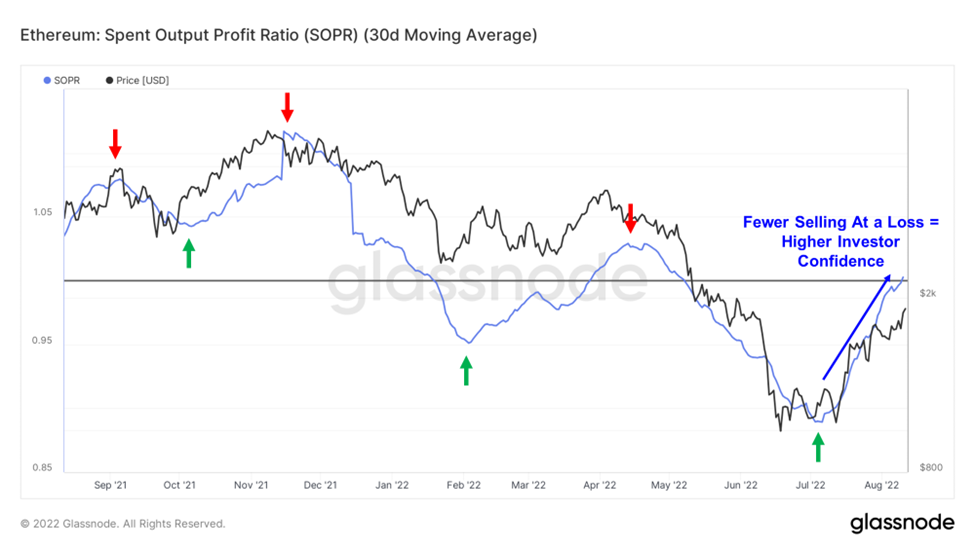
Below we revisit a chart we presented last week. At a high level, SOPR gives us an idea of the overall profitability of holders selling their ETH on any given day. If SOPR is below 1, investors are exiting positions at a loss, while a SOPR above 1 means the average holder is selling for a profit.
Therefore, SOPR trending higher essentially indicates that investors are gaining confidence that prices will continue to increase and are holding for a more profitable exit.
We can see below that the 30-day moving average has been a generally reliable trend indicator over the past 12 months, just surpassed 1, and is moving conclusively higher.
Bitcoin Still Less Constructive On-Chain
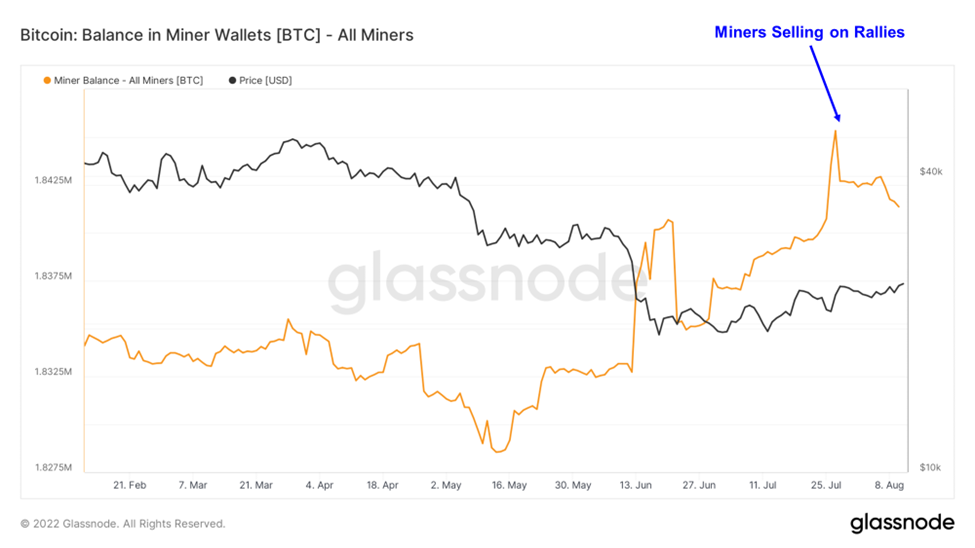
Our position that bitcoin will underperform major alts in the second half of this year continues to materialize as miners remain under significant pressure. Below, we see that since late July, miners have been net-sellers of BTC, indicating a need for liquidity among this cohort. This is in stark contrast to the liquidity dynamics post-Merge, as highlighted above.
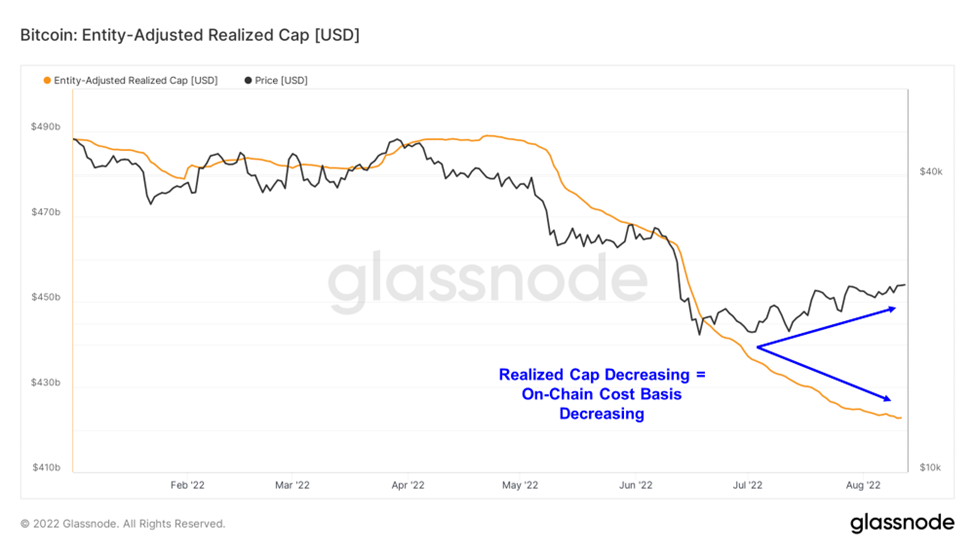
Realized cap, or the overall cost basis of all holders in the Bitcoin network, is still trending downwards. Realized cap can be best thought of as a proxy for the overall cost basis of the network. When realized cap is increasing, it means that more fiat is being exchanged for bitcoin at higher prices.
Since this metric continues to slope downwards, despite prices rising over the past month, it is evident that holders with higher cost bases are exiting the market and selling to those with a lower cost basis (or brand-new entities are buying in at these lower prices). Few investors with established positions are adding to their positions as price increases, demonstrating a lack of confidence in bitcoin’s price trend continuing.
Strategy
We continue to be long BTC -0.93% , ETH -1.03% , and SOL into year-end and think that Merge-adjacent names, including LDO, RPL, OP, and MATIC, still present attractive opportunities for high-beta plays into the Merge. Long and medium-term investors should look to use any dips as buying opportunities. The recent rally, coupled with prevailing market narratives and miner dynamics, suggests it might be wise to be overweight large cap altcoins in the medium term.


