
Historical Data Suggests Volumes Bottom This Week

Key Takeaways
- Spot market volumes for BTC remain subdued, contributing to recent choppy price action. Seasonal volume trends suggest that volumes typically rise post-Labor Day.
- The average cost basis per BTC has increased by over $10k since the start of the year. The accelerating year-over-year growth rate in BTC cost basis provides solid support for the continuation of the current bull market.
- Over the past 7 days, the Fed has completed its pivot toward a rate-cutting cycle, and Q2 GDP was revised higher. If Friday's PCE data comes in lower than expected, the market’s expectation of a soft landing could strengthen.
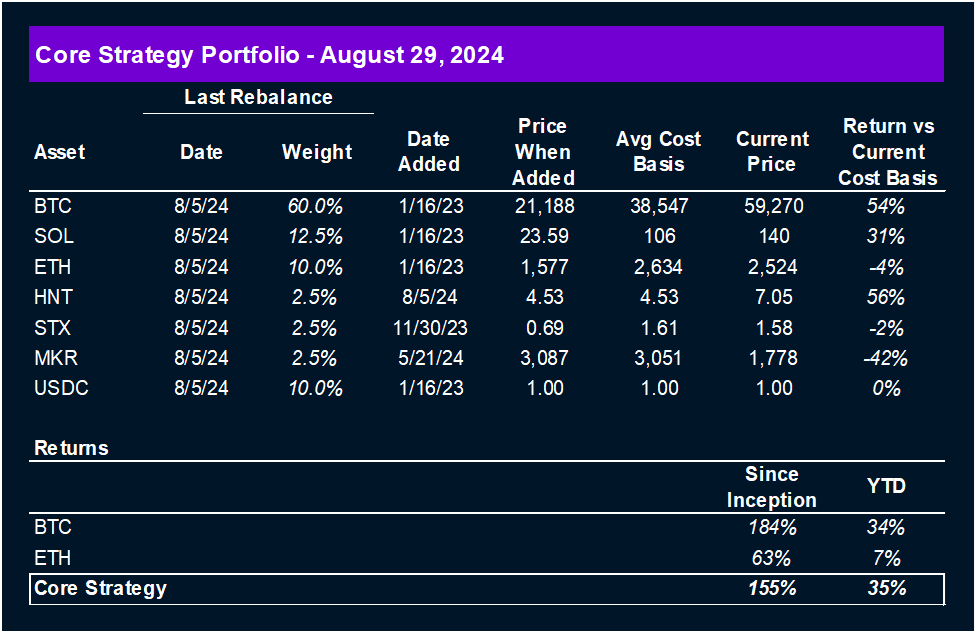
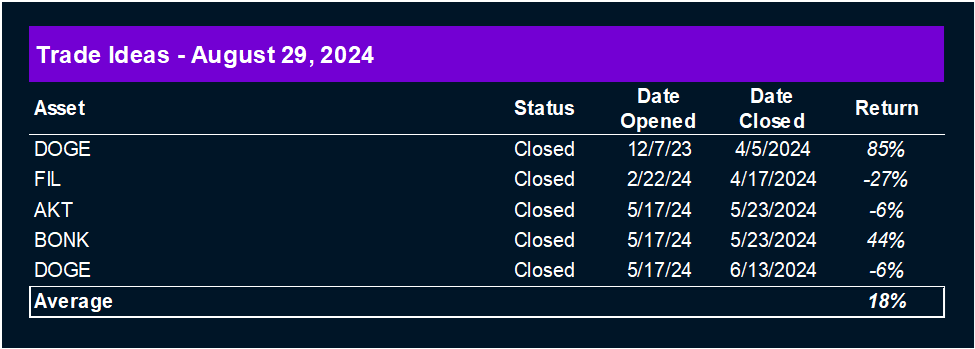
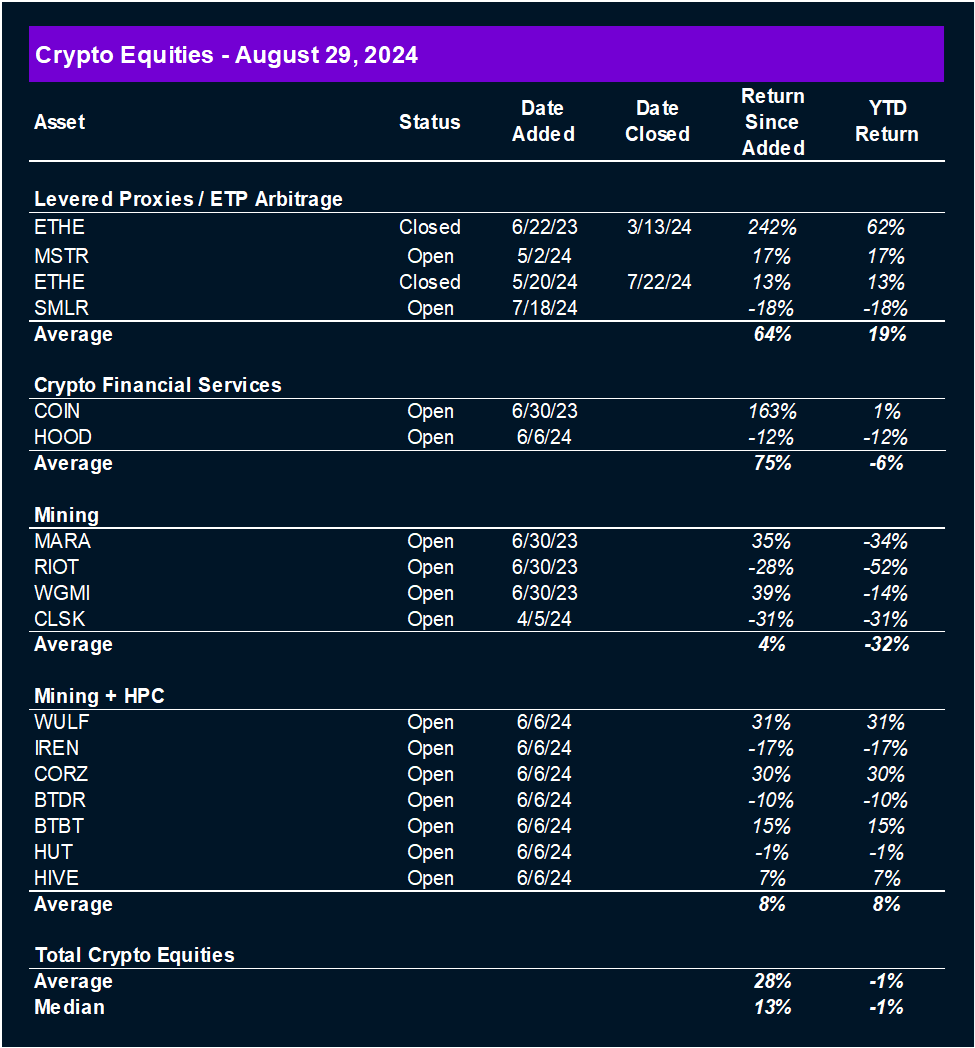
- Core Strategy – We are optimistic about the outlook for crypto heading into year-end and view a market moving toward a soft landing as constructive for prices. Our focus remains on the majors, with selective exposure to altcoins (HNT, MKR, STX), while keeping some dry powder on hand to account for geopolitical tail risks and negative seasonality. As a reminder our Core Strategy allocation model is featured at the end of each note along with our crypto equity baskets and trade recommendations.
Lower Volumes Persist
Earlier this week, we witnessed approximately $2B in open interest being unwound within a matter of hours—a significant forced deleveraging event for an otherwise uneventful Tuesday, lacking a clear catalyst.
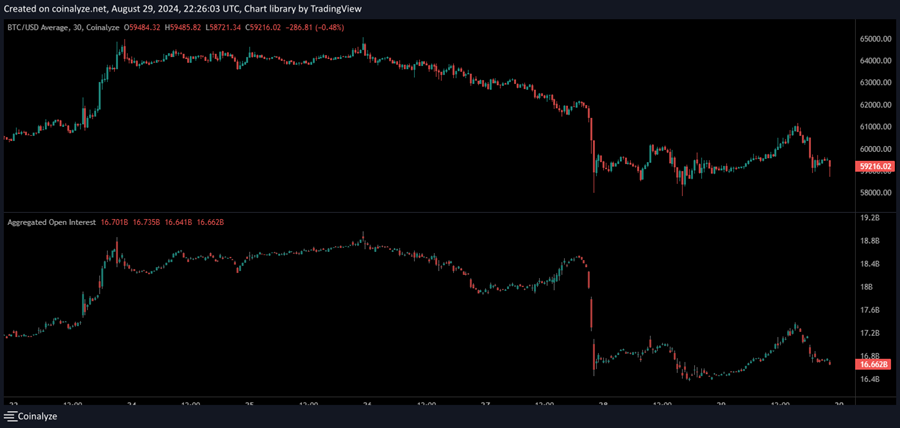
In our view, the selloff was largely technical and indicative of the negative seasonality we’ve been discussing recently. To backtrack, Monday and Tuesday followed a dovish Fed pivot at Jackson Hole, sparking a sharp rally in soft-landing plays like IWM and KRE—BTC included.
However, by Tuesday, this rally had lost steam. With substantial leverage built up and the macro backdrop stalling, there wasn’t enough spot demand to push prices higher, triggering the unwinding of that leverage in an already illiquid market.
It’s worth delving into some charts to better understand the dearth of spot market volumes.
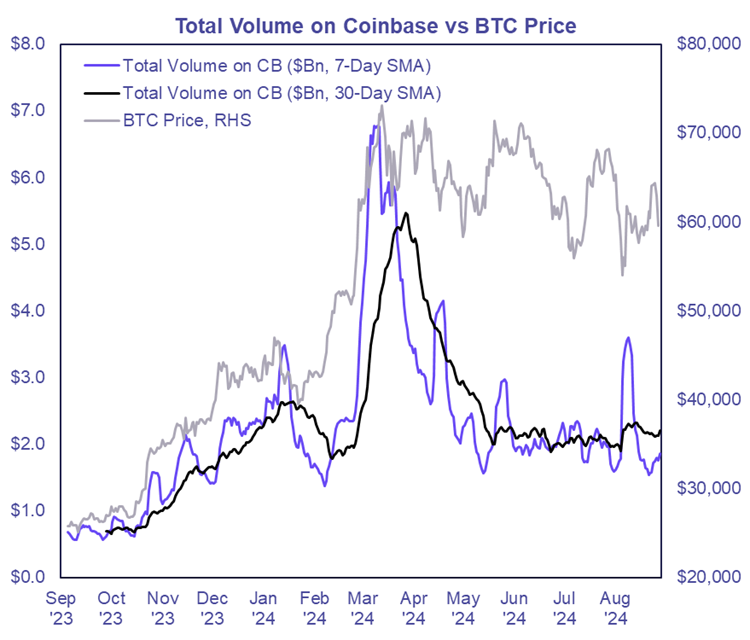
In summary, spot volumes remain consistent with summer doldrums levels and have trended lower since the yen carry trade unwind on August 5th. Notably, trading activity on Coinbase is particularly subdued, further evidence that the US institutional bid for BTC has yet to return.
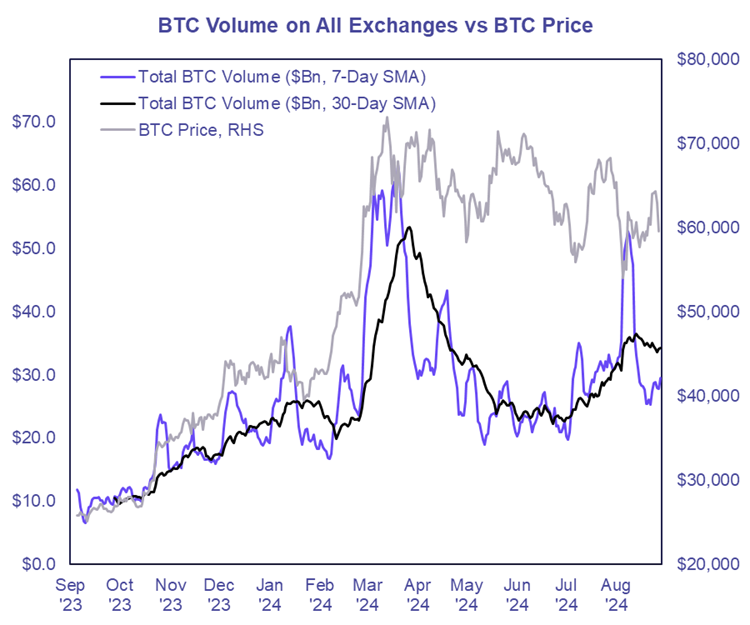
Below, you’ll find BTC volume data across all spot exchanges. The forced selling around August 5th caused a clear spike, but both the 7-day and 30-day moving averages have since declined. The shorter-term moving average crossing below the longer-term one suggests that volumes are trending lower as summer winds down.
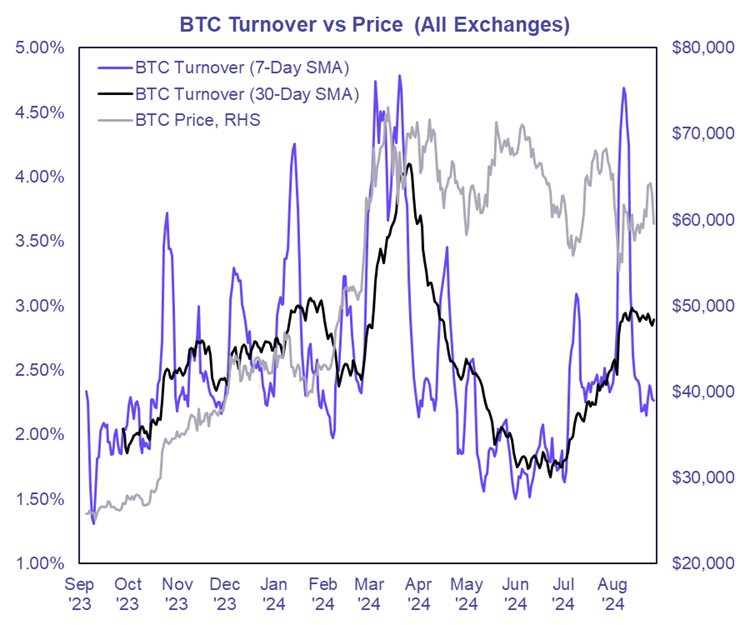
Since volumes in USD terms can be misleading due to BTC’s price fluctuations, it’s useful to examine BTC turnover (volume divided by market cap). Typically, BTC turnover ranges between 1.5% and 5% annually—the higher the turnover, the more BTC trades hands.
Interestingly, the 7-day moving average turnover has significantly decreased over the past few weeks. While not as depressed as May and June levels, it is notably lower than in Q4 2023 and Q1 2024.
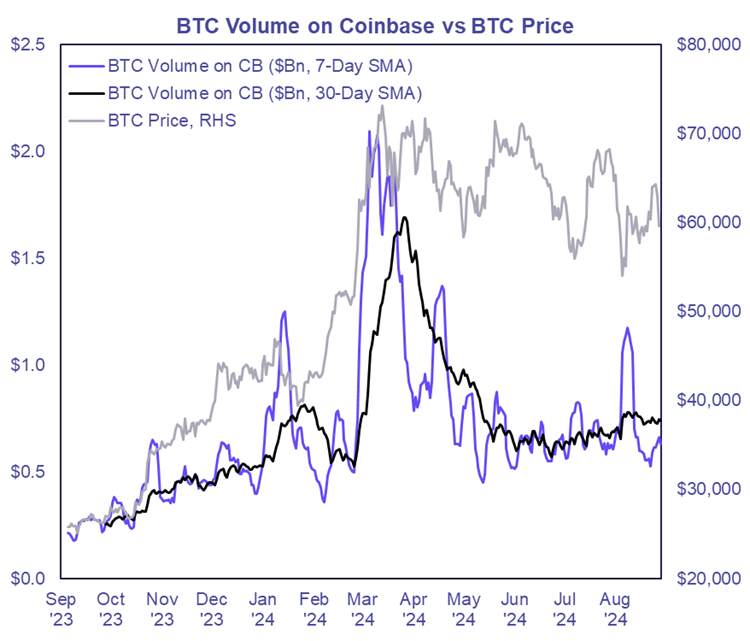
Zooming in on Coinbase specifically, a similar pattern emerges—the 7-day moving average is actually comparable to the market doldrums of May and June. Moreover, unlike the global exchange data, Coinbase did not experience a significant volume bump in July.
As expected, the total volume (all assets) chart mirrors the BTC volume trends, but recent volumes are arguably lower than what we saw throughout the summer.
The key takeaway here is that, in the immediate term, market moves in both directions may remain choppy and abrupt, as evidenced by Tuesday’s action, due to the lack of spot market activity.
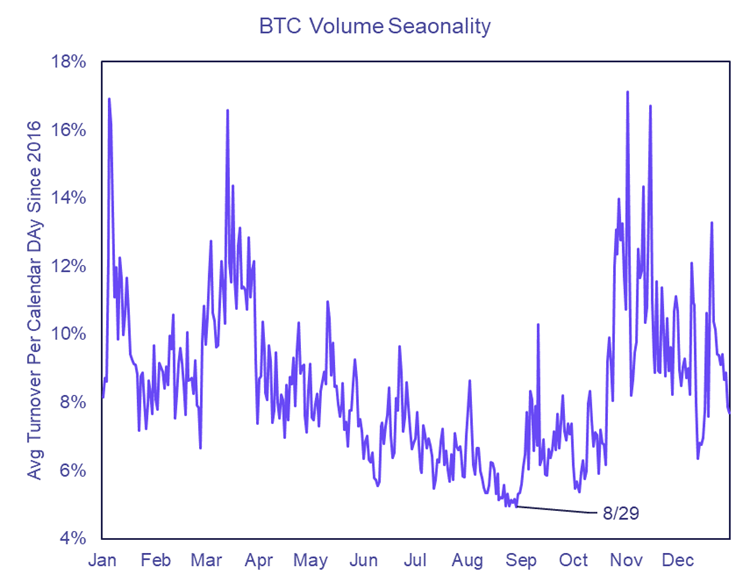
However, with Labor Day approaching, we anticipate a return of market participants, potentially increasing liquidity. Historically, this is the turning point for market liquidity, as evidenced by the chart below documenting the average BTC turnover per day since 2016. Interestingly enough, the historically lowest volume day of the year is August 29th.
Average Cost Basis Per BTC Up $10K Since Start of the Year
As we approach what we anticipate to be more favorable conditions for crypto prices, it’s crucial to highlight the substantial BTC supply exchanged year-to-date, particularly within the $50-70k range where we’ve been consolidating for nearly six months.
While a supportive macroeconomic environment is ultimately necessary for a significant breakout, the extent of consolidation observed suggests that BTC’s price ceiling may now be higher than prior to our consolidation phase above $50k.
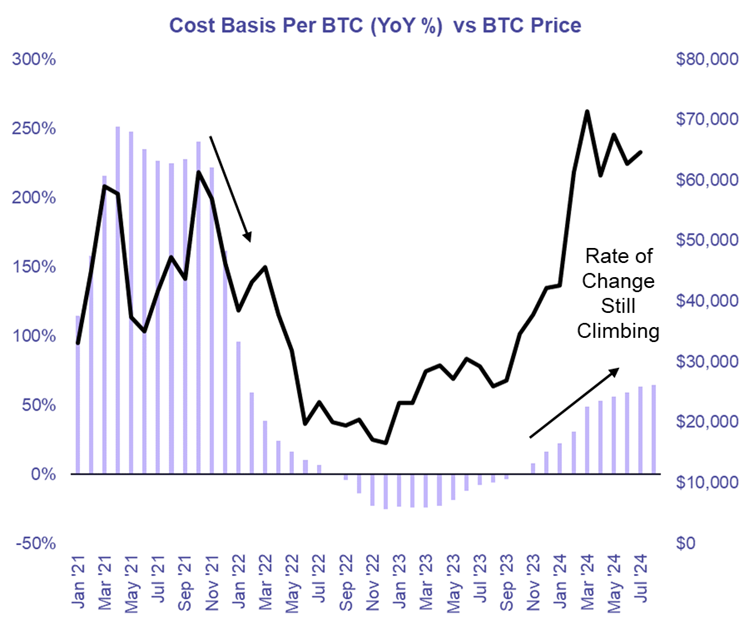
The chart below demonstrates that the average cost basis per BTC has risen markedly since the beginning of the year, increasing by over $10k since the end of December.

This concept is not necessarily specific to BTC – we are in many ways just describing consolidation. But in our view, the transparency of BTC and the lack of passive flows, makes tracking this metric more important information. This is also a key input to our MVRV metric, which has historically served as a good measuring stick to determine when BTC is priced at a particularly frothy valuation.
Perhaps more important than the nominal cost basis per coin, is the rate of change in this cost basis, as this essentially measures the strength and pace of capital flows into the bitcoin network.
As evidenced by the chart below, if the cost per coin continues to rise at an increasing growth rate, it indicates strong demand from newer investors willing to buy at higher prices from those with a much lower cost basis—essentially measuring “new inflows.”
The chart also shows that when this rate of change begins to change direction, it often coincides with a peak or rough of a cycle.
Seasonality Still Working Against Us, But Market Data Still Points to Soft Landing
Some quick macro thoughts this week:
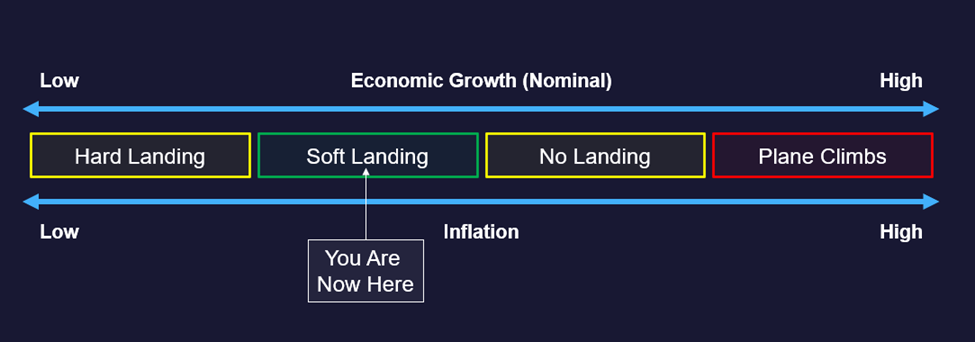
Below is our roadmap for crypto and the Fed. We discussed how to think about this map in our note a few weeks ago. Essentially – green means go, yellow means proceed with caution, and red means we are in store for some hurt.
Following Powell’s comments at Jackson Hole, we moved definitively towards the left of this diagram – or more specifically, we moved farther away from the plane climbing. Consider the fact that now, should inflation surge at some point in the near future, it will likely take a few months of hot inflation data to compel the Fed to renege on their Jackson Hole comments and actually hike rates again – this removes the most dire scenario from the picture.
The question now is to what degree do we oscillate from hard landing and no landing and back to soft landing over the course of the next couple of quarters.
Well the GDP revision today certainly moves us away from the hard landing scenario. The government revised GDP higher to 3% – hardly recessionary or reflective of a hard landing.

We have PCE tomorrow, which is the Fed’s preferred inflation benchmark. Thus, if Core PCE comes in cool tomorrow, one would expect strength out of soft-landing names.
Core Strategy
We are optimistic about the outlook for crypto heading into year-end and view a market moving toward a soft landing as constructive for prices. Our focus remains on the majors, with selective exposure to altcoins (HNT, MKR, STX), while keeping some dry powder on hand to account for geopolitical tail risks and negative seasonality. As a reminder our Core Strategy allocation model is featured at the end of each note along with our crypto equity baskets and trade recommendations.
Tickers in this report: BTC -4.11% , SOL -3.15% , ETH -3.13% , HNT -2.18% , STX N/A% , MKR 1.76% , USDC 0.00% , MSTR -5.44% , SMLR, COIN -6.33% , HOOD -5.82% , MARA -1.13% , RIOT -0.88% , WGMI 2.36% , CLSK 1.97% , WULF 4.00% , IREN 5.85% , CORZ -2.43% , BTDR 3.08% , BTBT 1.26% , HUT 0.80% , HIVE -0.47%