
Competing Forces

Key Takeaways
- We posit that the recent decline in volatility can be attributed to competing forces, (1) positive industry-specific tailwinds, and (2) negative macro headwinds.
- The recent dip in macro correlations can be attributed to unique catalysts, notably the BlackRock ETF application. Without further industry-specific catalysts, it’s likely that traditional macro correlations return.
- There are reasons to be optimistic about the near-term macro setup, including potential stimulus from a deflationary China and the possibility of the DXY rolling over on a softer-than-expected CPI print.
- Bitcoin's price, now near the 200-day moving average at around $27k, has historically faced significant resistance at this level, suggesting limited short-term downside risks.
- Core Strategy – Despite seasonal headwinds and the potential for lackluster liquidity conditions to persist, we maintain our view that the risk asymmetry this year remains to the upside, and it would be irrational to take much risk off the table with so many potential positive catalysts on the horizon.
Macro Headwinds vs. Idiosyncratic Tailwinds
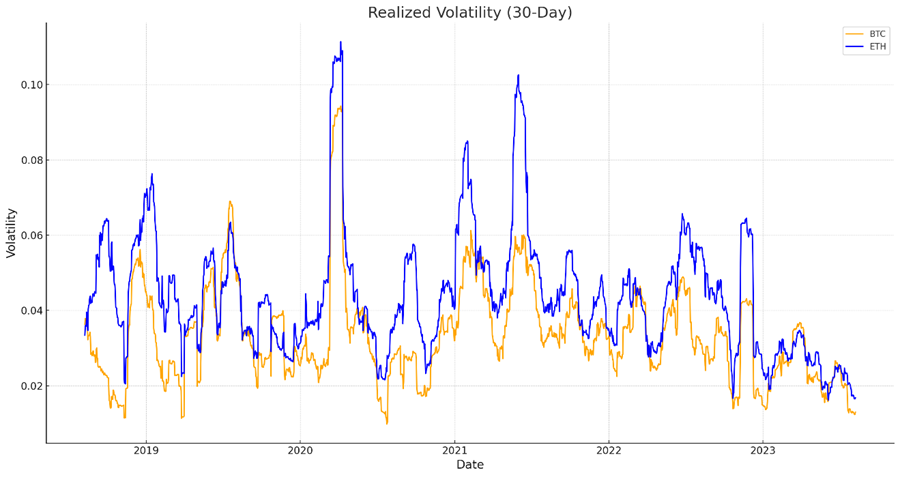
In our prior notes, we highlighted the market’s prevailing sideways trend. Over much of the past month, both BTC and ETH have exhibited remarkable stability, moving within a narrow range. Their realized and implied volatilities are nearing all-time lows.
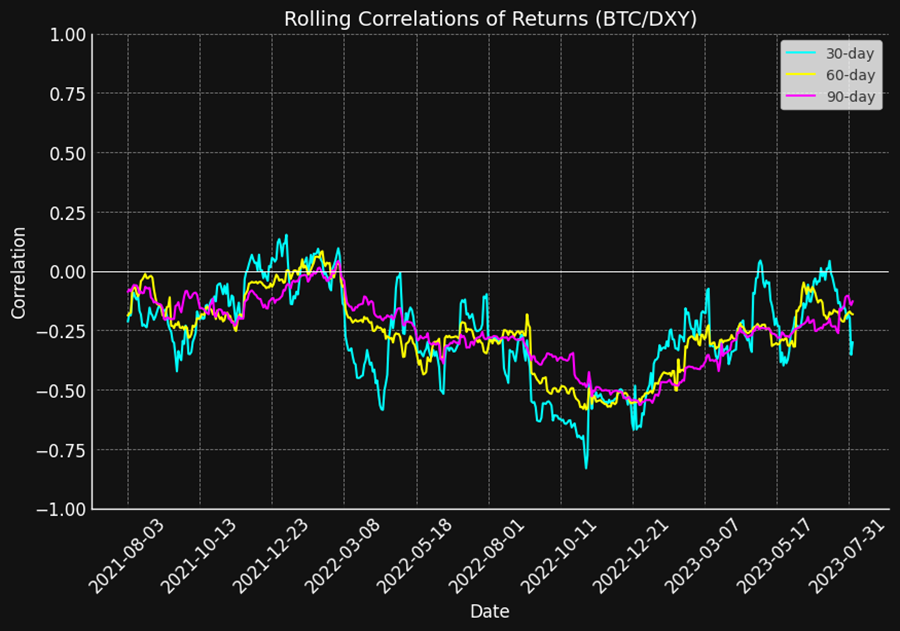
We’ve also emphasized the waning correlation between Bitcoin’s daily returns and macro assets such as tech stocks and the US dollar index. These correlations have approached zero across most timeframes.
This market seems caught in “no man’s land,” pinned by contrasting forces. On one side, macro indicators are pressuring a potential price dip. Conversely, a stream of positive catalysts favoring crypto has emerged.
Nestled between these countering forces, BTC remains steady, swaying between $28k and $30k.
Consider the following chart that captures a telling example of catalyst-driven rally squashed by a local top in market liquidity.
The chart below shows a bitcoin rally that spanned from March to early April, instigated by the regional banks’ meltdown, paving the way for friendlier short-term liquidity conditions in the banking sector. Given Bitcoin’s sensitivity to market liquidity conditions, it unsurprisingly rallied past the $30k mark. Yet, by mid-April, the momentum tapered off.
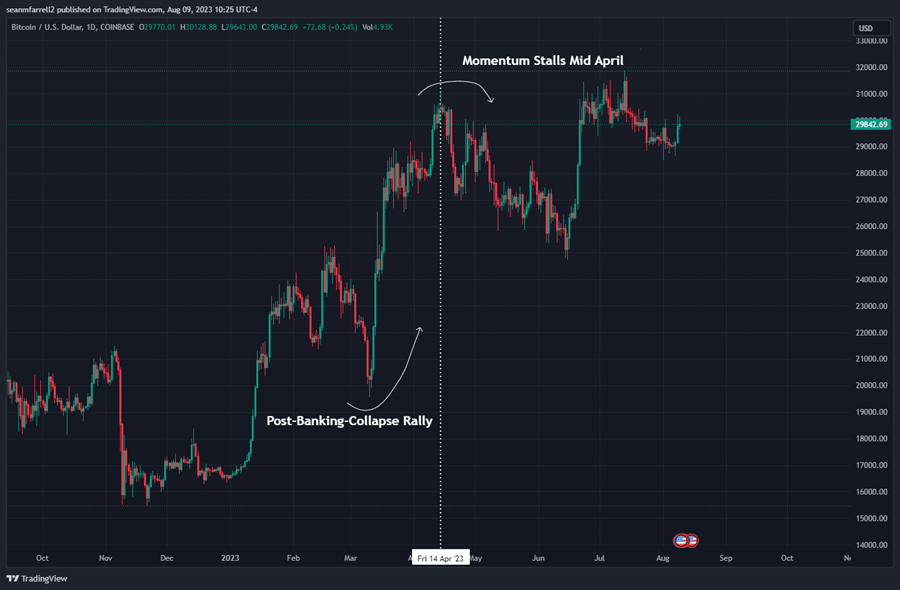
Why this abrupt halt in momentum?
The debt ceiling agreement was still pending, resulting in the continued draining of the TGA. However, the RRP uptake remained steady, and much of the debt the Fed extended to banks started seeing repayments, leading to a liquidity decrease in mid-April.
Broadening this perspective, global liquidity conditions might have also played a part. The PBOC and BOJ rolled back their accommodative stances in April, and a DXY running into downside resistance added to the rally’s stagnation.
We observed a more pronounced decline following this rally (from over $30k to $25k) likely due to the relative lack of positive catalysts at the time. The market was yet to be greeted with a BlackRock ETF application, nor was it as confident about a possible Grayscale victory, and Ripple had yet battled and won its case against the SEC.
Fast forward to the most recent rally, and we see a similar dynamic, however, the downside has been less pronounced, likely due to the deluge of fundamental tailwinds specific to bitcoin and the crypto industry.
This most recent surge was a direct response to Blackrock’s spot BTC ETF application, a landmark event for the space from both a fundamental and narrative viewpoint. This led to a reevaluation of regulatory risks and piqued our interest in exploring crypto equity trades.
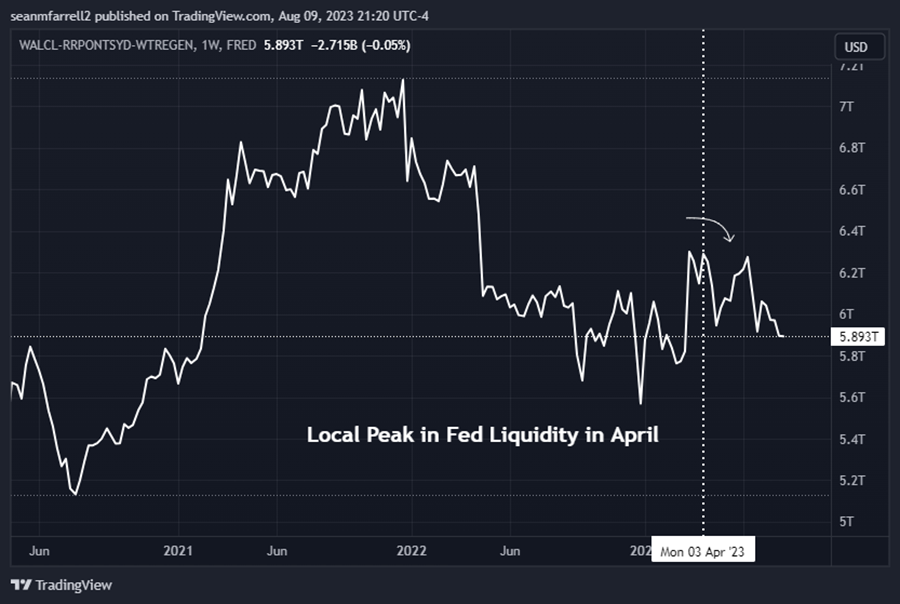
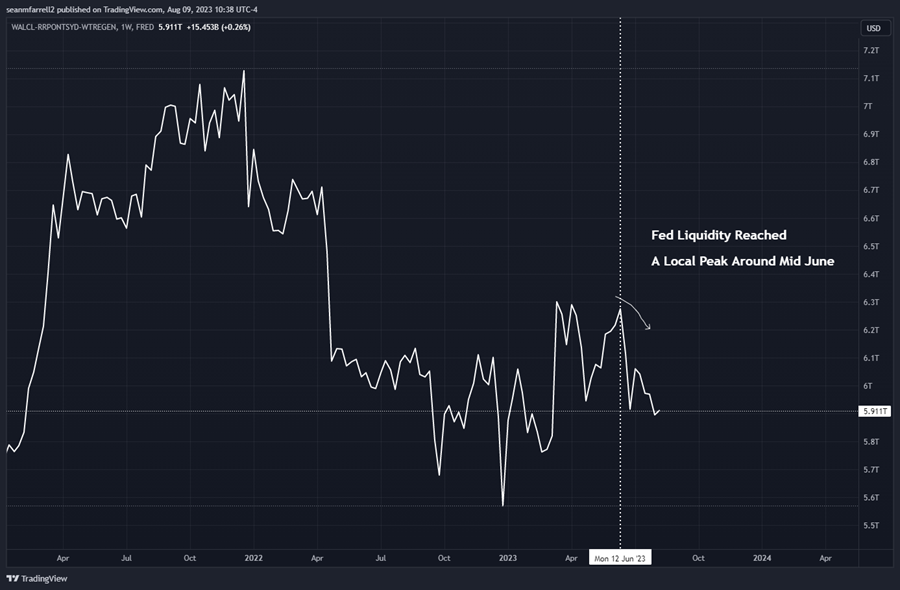
Yet even this rally lost steam soon after the Blackrock catalyst. Based on the ensuing chart, this rally most likely lost momentum due to another liquidity peak in mid-June as the treasury initiated the TGA refilling process and the Fed continued with its normal pace of QT.
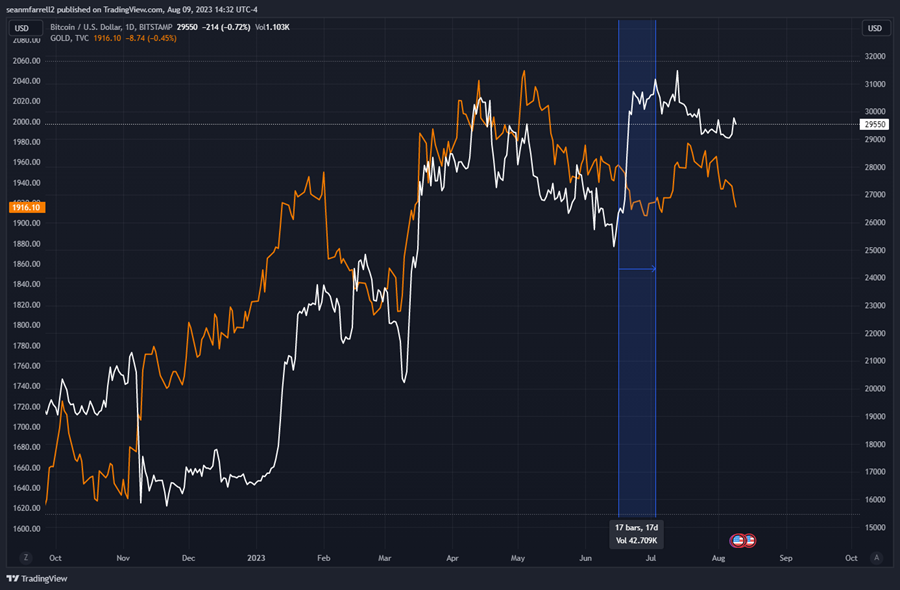
It is quite telling that other liquidity-sensitive commodities like gold depicted price weaknesses during bitcoin’s rally.
If we were to eliminate this parabolic rally, BTC has continued to generally mirror gold’s trajectory.
To summarize:
- The dip in correlations between bitcoin and other macro assets can be attributed to unique, crypto-specific factors, notably the BlackRock ETF application.
- While positive forces are providing a price support for BTC, overarching macro trends are capping near-term upside.
- Without further industry-specific catalysts, it’s likely that the traditional macro correlations will reestablish themselves.
Reasons to be Optimistic about the Near-term Macro Setup
On that note, it is important to note that there are reasons to be optimistic from a macro perspective.
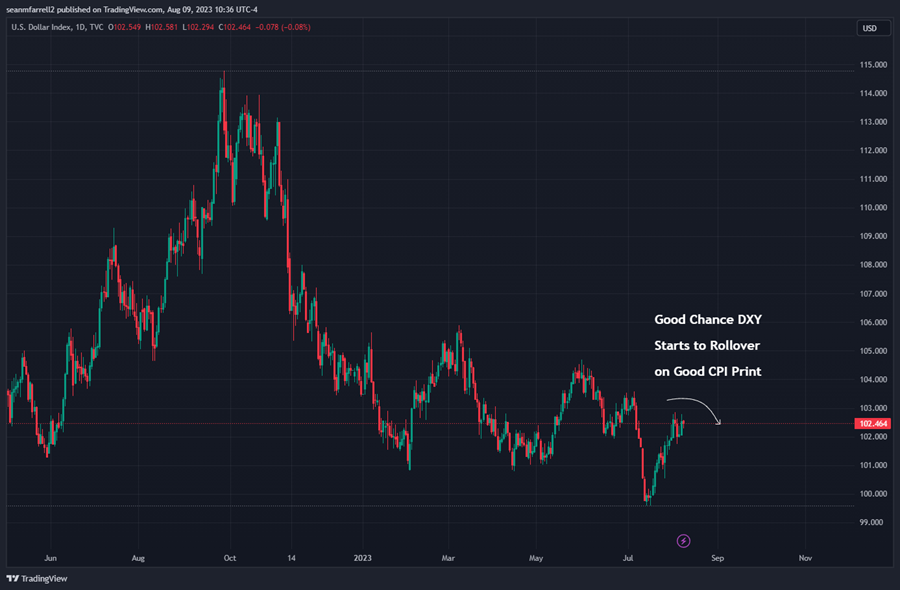
Rates, and by extension the US dollar, have surged recently due to credit rating downgrades, a rise in Japan’s rates, increased coupon issuance from the treasury, among other reasons.
Recent unsettling deflationary data from China also contributed to a spike in the DXY. Nevertheless, with a potential soft core CPI print on Thursday, we might soon witness the DXY encountering upward resistance.
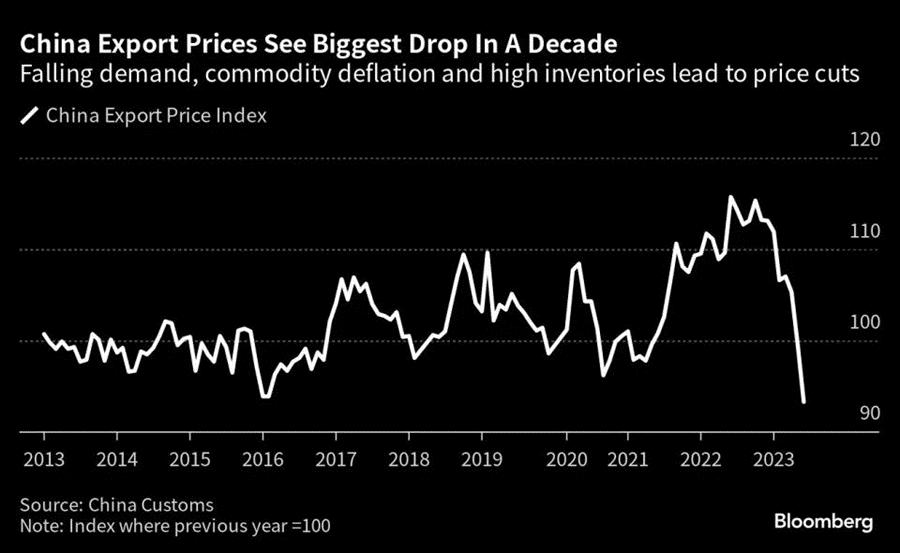
Moreover, the current economic data out of China paints a rather ominous picture for their local economy, underscored by plummeting export figures and a YoY decline in consumer goods prices. This suggests that domestic demand is virtually non-existent. We wouldn’t be surprised if the PBOC introduces significant stimulus measures in the upcoming weeks.
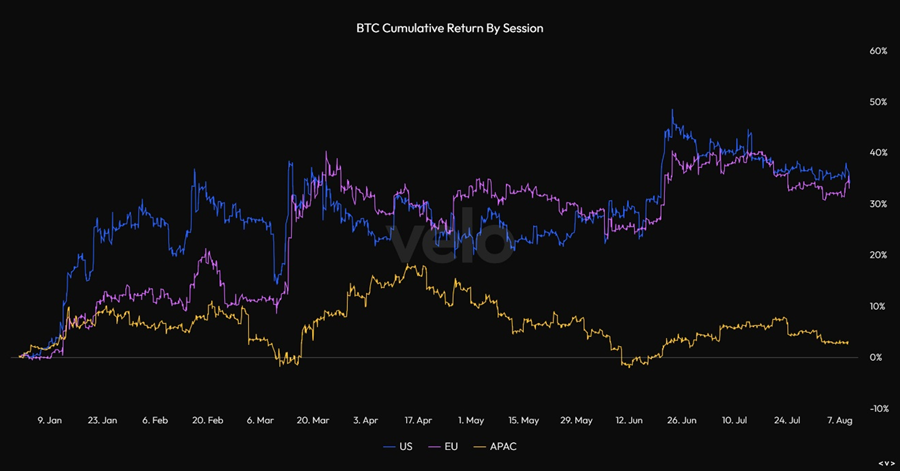
It’s noteworthy that the most robust price action periods have correlated with bullish regional performance from APAC. A shift back to favorable monetary conditions in China might boost crypto asset prices in the short run.
Reminder of Seasonal Headwinds
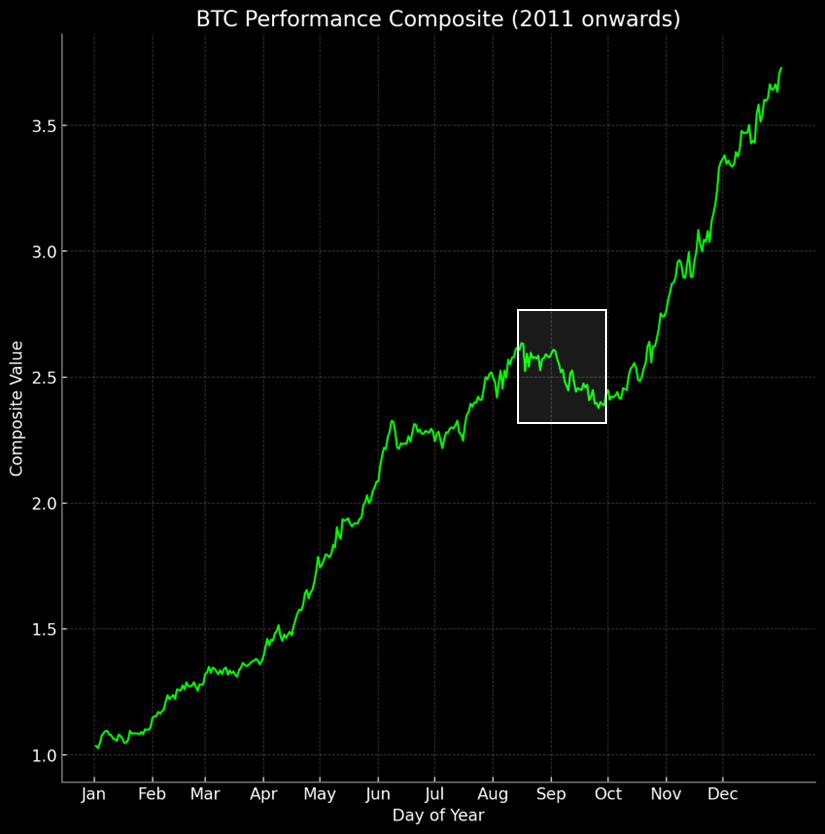
Despite this optimism, we must remember the ongoing seasonal challenges. Historically, from early August through late September, Bitcoin and the broader crypto space, on average, face challenges. This trend is illustrated in the subsequent chart, detailing the average daily performance across each calendar year since 2011.
Thus, it is possible that we see challenging price action for reasons simply tied to seasonal dynamics. The late summer months are often characterized by lower trading volumes, higher spreads, and many traders staying on the sidelines, which could lead to surprising price action.
Volatility Still Churning = Historically a Buy Signal
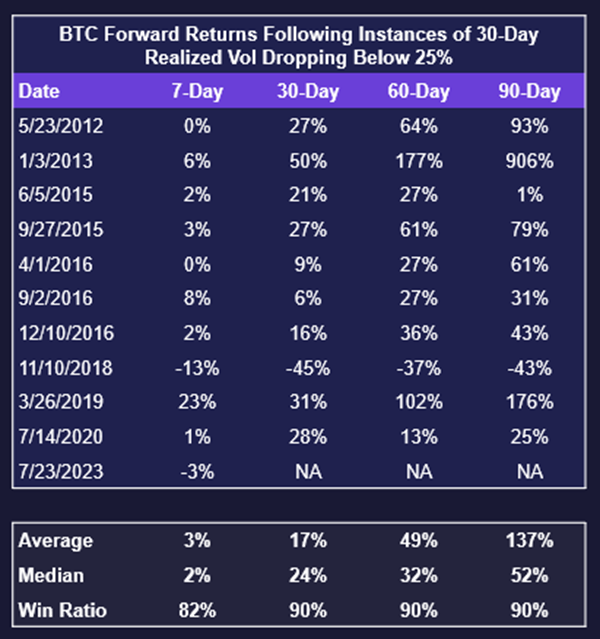
A decline in volatility is noteworthy for potential bullish trends. Bitcoin’s recent stagnation has been almost tedious. The 30-day realized volatility for BTC is now at its lowest since July 2020. Historical data shows that when 30-day volatility falls below 25%, forward returns are predominantly bullish, boasting impressive win ratios across varying timeframes. This trend suggests that Bitcoin’s low volatility phases set the stage for significant upward price shifts.
Limited Downside Based on 200-Day SMA
Risk management, in our view, heavily relies on discerning risk asymmetries. While the long-term upside risk for crypto is evident, short-term risks are influenced by catalysts, fundamentals, and technicals.
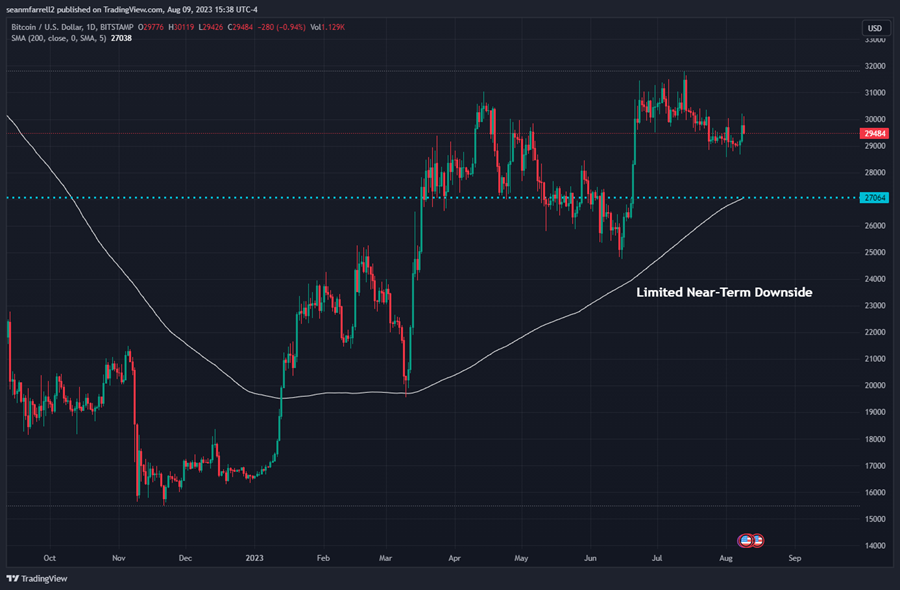
Bitcoin’s current lateral movement has brought its price close to the 200-day moving average, hovering around $27k. Historically, the 200-day SMA has been pivotal for BTC, acting as a significant resistance level once already this year.
Thus, the proximity to the 200-day SMA mitigates short-term downside risks.
Something’s (Still) Gotta Give
This analysis has introduced a range of data – some constructive, some not as constructive. While there’s an existing seasonal headwind for crypto, liquidity conditions seem poised to improve, although it’s not guaranteed.
Considering all the factors at hand, we argue that reducing risk now would be imprudent given the array of positive indicators and potential near-term catalysts.
In summary, reasons to stay invested in the short-term include:
- Volatility compression typically precedes favorable returns.
- The impending Grayscale decision, likely resulting in a reduced discount to NAV for both GBTC and ETHE.
- Growing optimism regarding the approval of a spot Bitcoin ETF.
- Recent proposals for Ethereum futures ETFs, indicating a positive stance on potential approval.
Core Strategy
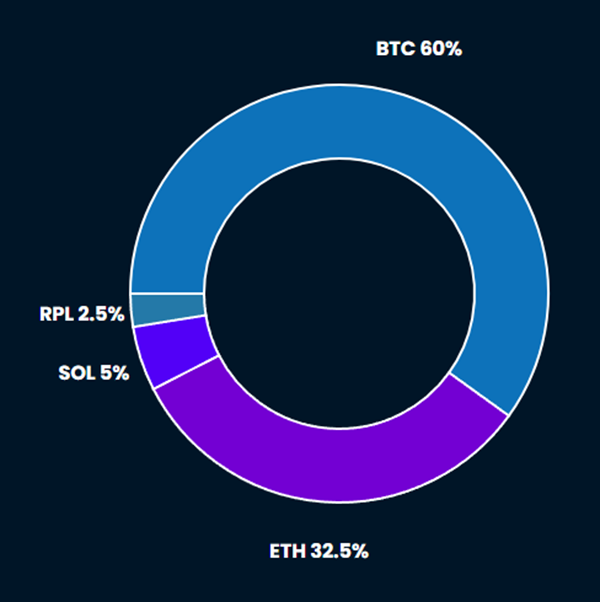
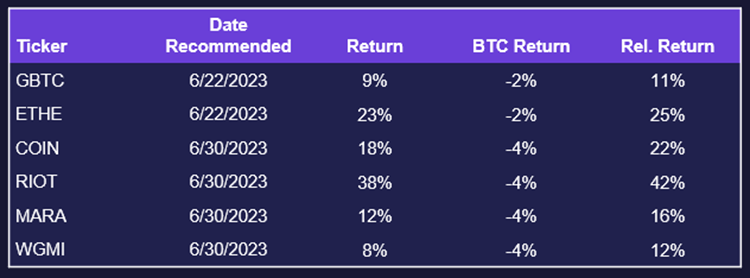
Active Crypto Equities Trades (Returns Through 8/9)
Tickers in this report: RPL, SOL, ETH -2.76% , BTC -2.24% , GBTC -2.38% , ETHE -2.95%