
A Tale of Two Markets

Key Takeaways
- Previous observations highlighted how the decline in crypto prices signaled a temporary liquidity peak, potentially tied to the impending debt ceiling deal. Correlations between BTC, gold, and equities illustrated BTC's sensitivity to liquidity changes. As anticipated, BTC/Gold and BTC/equities (excluding AI-related names) correlations are now strengthening, with gold and equities tracking BTC's lead.
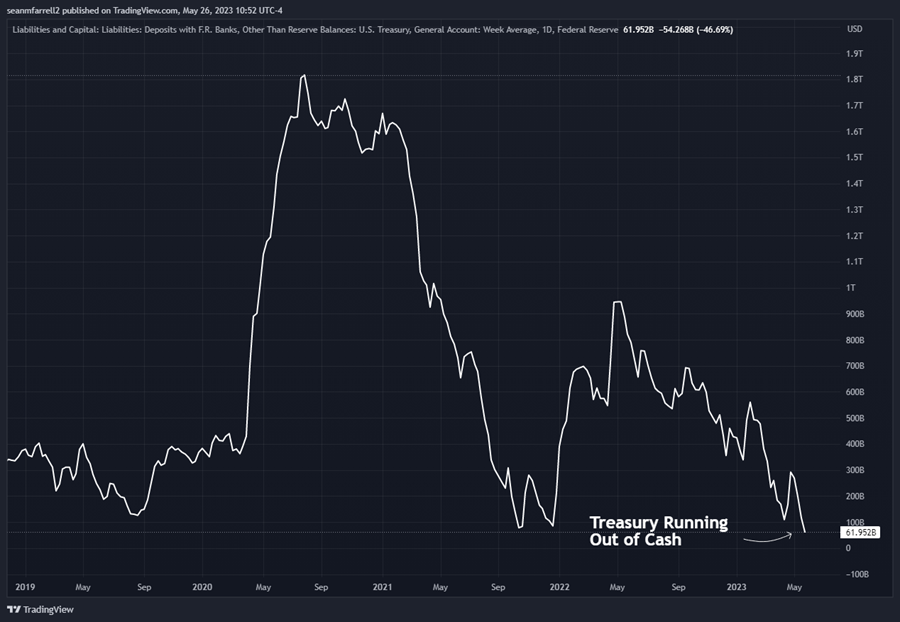
- The Treasury General Account (TGA) balance is nearing a critical level at $62 billion, necessitating replenishment. To address concerns about reduced market liquidity, we have created an illustration of the potential impact of upcoming $733 billion treasury issuances. Our projection indicates an initial decline in liquidity, followed by a relatively quick recovery.
- To summarize our views on the debt ceiling, in a "no deal" scenario, we expect a narrative-driven rally in Bitcoin, while a deal would likely lead to a short-term drawdown in risk assets followed by a resurgence as bank deposits normalize. Two factors that could impact our near-term views are the potential participation of Hong Kong in crypto, which could offset the liquidity drawdown and be viewed as bullish, and the impact of an additional rate hike without a pause from the Fed, which is seen as bearish.
- Core Strategy – Despite our recommendation in late April to raise cash in anticipation of a near-term resolution to the debt ceiling (TGA refill = lower market liquidity) and recent negative price movements, our overall outlook for the year remains positive. If the Federal Reserve follows through with a pause, it would be a positive development for assets sensitive to liquidity conditions.
AI Skewing the Picture
Previous observations highlighted how the decline in crypto prices signaled a temporary liquidity peak, potentially tied to the impending debt ceiling deal. Correlations between BTC, gold, and equities illustrated BTC’s sensitivity to liquidity changes. As anticipated, BTC/Gold and BTC/equities (excluding AI-related names) correlations are now strengthening, with gold and equities tracking BTC’s lead.
Over the past few weeks, our discussions have centered around an observed shift in market dynamics, seemingly prompted by the ongoing debt ceiling standoff and the potential for a resolution in the coming weeks. Recognizing the beginning of a downturn in Bitcoin and the broader crypto market about a month ago, we engaged in conversations regarding raising cash. This decision was informed by the crypto market’s tendency to detect alterations in market liquidity conditions ahead of other asset classes. Consequently, it is understandable that there was a delay before gold and the equities market began to perceive impending changes.
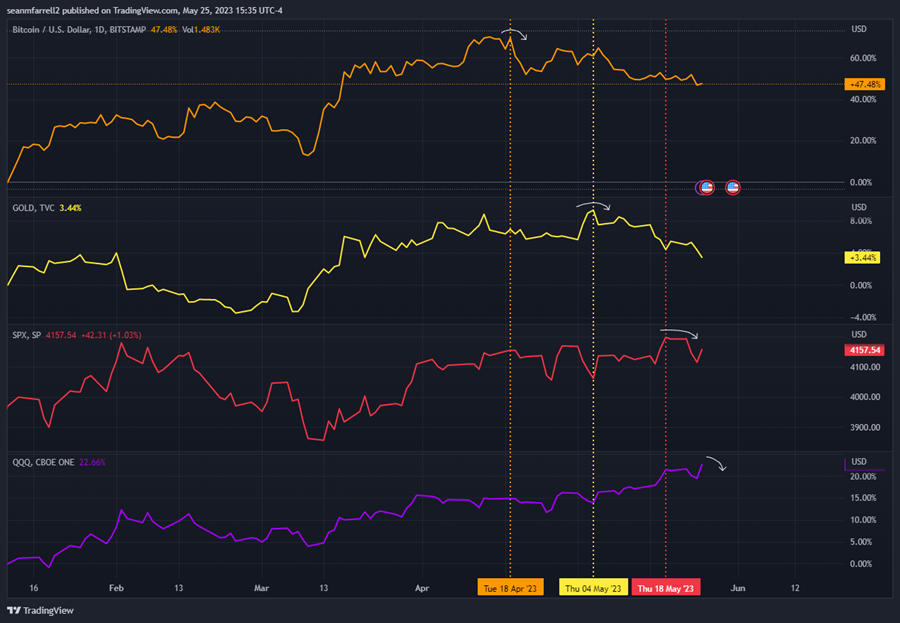
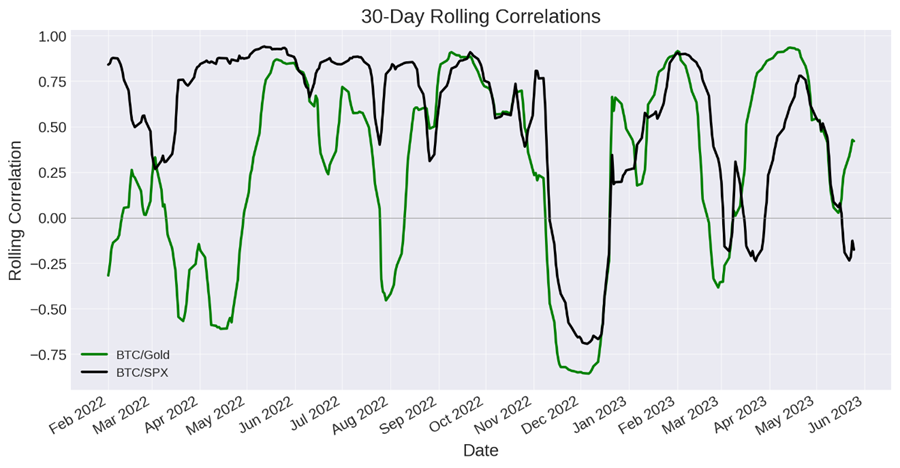
Additionally, in the past week, we have observed that gold has begun to exhibit a similar pattern to that of bitcoin. As depicted in the chart above, gold seems to be rolling over in a manner reminiscent of bitcoin’s movement several weeks ago. Moreover, the correlation between these two assets is once again strengthening, as indicated below. Furthermore, although there is still a noticeable divergence, it appears that equities are also beginning to track the trajectory of bitcoin and gold.
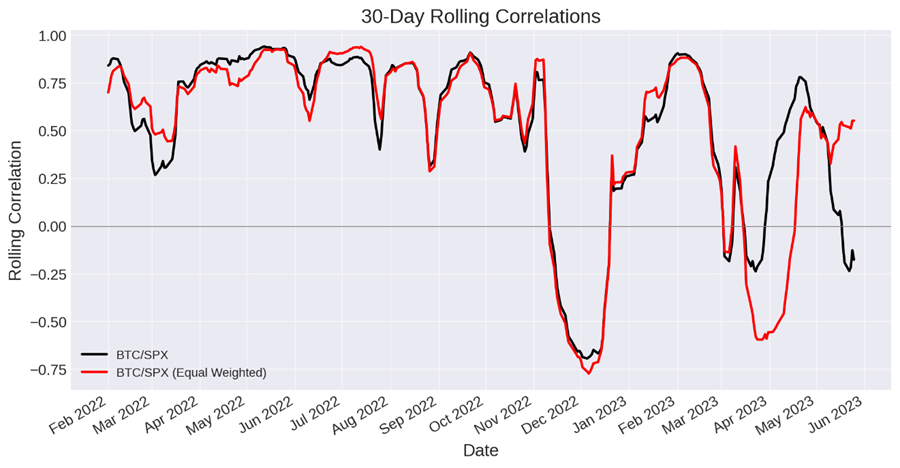
Furthermore, upon further analysis, it becomes evident that the top-heaviness of the equities market is primarily responsible for the divergence observed among the asset classes. To illustrate this, let’s consider the 30-day rolling correlations between the market cap-weighted S&P 500 and the equal-weighted S&P 500. A noticeable separation between these two metrics becomes apparent, starting in mid-May. This separation aligns with the ongoing rally in mega-cap technology stocks, which has exerted a significant influence on the overall performance of the market.
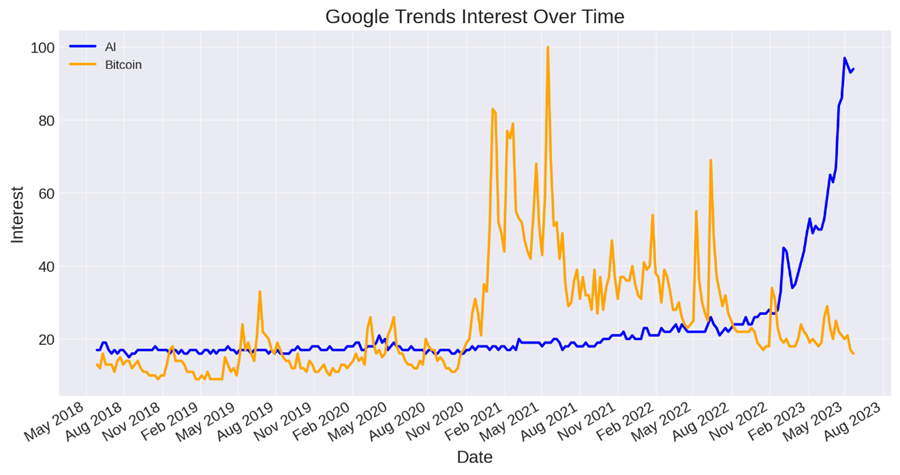
The rally in mega-cap technology stocks is being fueled by the AI phenomenon, which benefits from both fundamental factors and a positive narrative. Artificial intelligence’s potential to revolutionize industries and drive innovation contributes to its strong fundamentals. Moreover, the captivating narrative surrounding AI and its transformative capabilities has garnered investor enthusiasm, further boosting the momentum of AI-related companies.
Once the debt ceiling fiasco is resolved, it will be important to consider the lead/lag relationship that we believe exists among BTC, gold, and equities. If a debt ceiling resolution occurs and subsequently leads to a decrease in private market liquidity, it is likely that BTC will reach its local bottom before gold and equities.
Bottom Line As it Pertains to Market Correlations: Previous observations highlighted how the decline in crypto prices signaled a temporary liquidity peak, potentially tied to the impending debt ceiling deal. Correlations between BTC, gold, and equities illustrated BTC’s sensitivity to liquidity changes. As anticipated, BTC/Gold and BTC/equities (excluding AI-related names) correlations are now strengthening, with gold and equities tracking BTC’s lead.
Illustrative Liquidity Projection
Our clients and subscribers are well-versed in one of our favored methods for monitoring market liquidity – the net liquidity metric. This metric combines total federal assets, excluding reserves in the Treasury General Account (TGA), with capital in the Reverse Repo Program (RRP).
Of significant importance now is the TGA, which serves as the treasury’s bank account. Currently, with the TGA balance dwindling to $62 billion, it becomes evident that the treasury will soon need to raise capital through treasury issuance. While June 1st may not be the actual “x-date” for the debt ceiling deal given its proximity, the reduced TGA balance reinforces the impending necessity for capital infusion.
We have consistently emphasized the likelihood of a market dip driven by the forthcoming treasury issuance of nearly $1 trillion. As previously mentioned, we have already seen some effects of this in the crypto market. To gain a better understanding of the potential impact on liquidity, we have decided to utilize the treasury issuance schedule to model the potential effects on market liquidity.
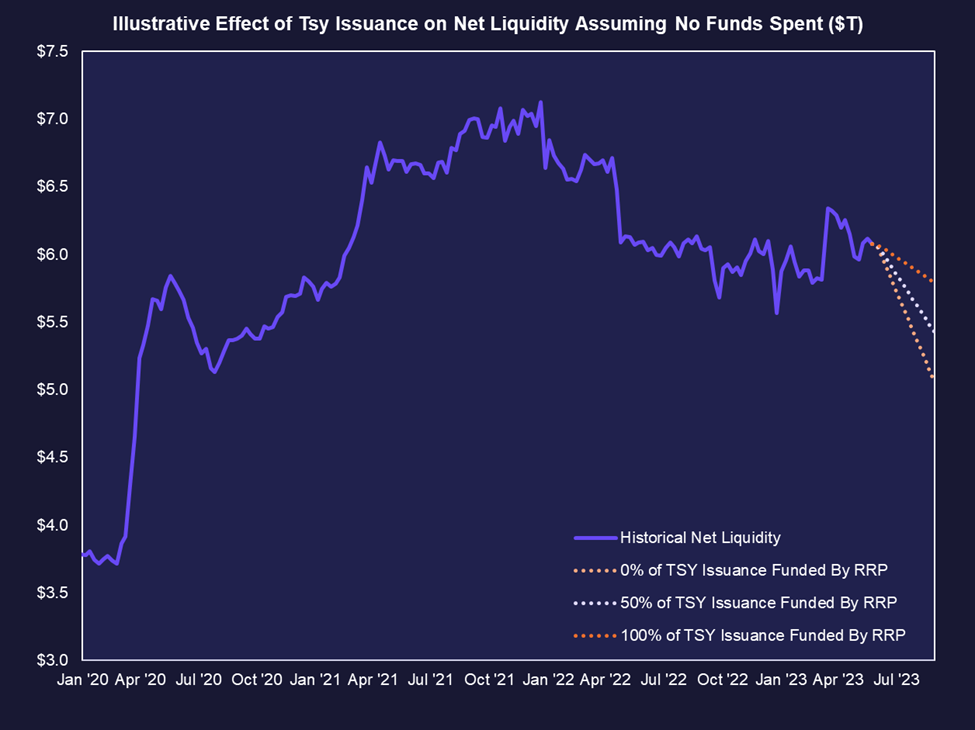
The projection we present serves as an illustrative demonstration of “liquidity needs” and extends until the end of August. It is important to note that this model does not account for any treasury spending, as that would be unrealistic. The issuance is evenly spread across increments and assumes the following:
- New treasuries will begin to be issued during the week of 6/7, although this is subject to change.
- QT continues at a pace of $95 billion per month.
- There is no change to the RRP balance outside of funding for new treasury issuances.
- The total new issuance, including bills and coupons, amounts to $733 billion, distributed evenly until 8/31.
- Funding sources can come from both the Reverse Repo Program (RRP), which has a net neutral impact on liquidity, and bank reserves, which have a net negative impact on liquidity. We have considered different scenarios for treasury funding sources, but we believe that most of the funding is likely to come from reserves.
- Again, it is important to note that this exercise does not account for payments made by the treasury, which will undoubtedly occur throughout the quarter and have a net stimulating effect on the market through deposit creation.
As depicted in the model based on the variables described above, it is apparent that the reduction in net liquidity, if those assumptions were to hold true, would likely lead to levels comparable to those observed in late 2020. It is important to reiterate that this projection does not necessarily represent the probable outcome. Overall, our outlook remains positive on crypto prices for the remainder of this year, and the scenario presented below does not align with that view.
Nevertheless, this exercise serves as a valuable tool for visualizing the magnitude of liquidity required to meet the demand for treasuries in the foreseeable future. It underscores the significant liquidity needs that must be addressed to accommodate the forthcoming treasury issuances.
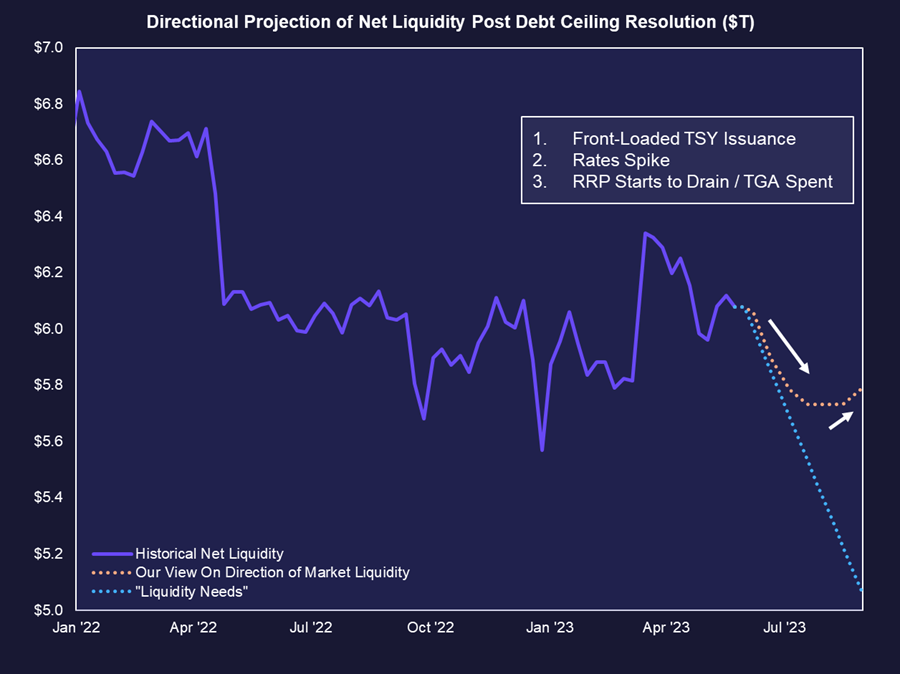
This follow-up exercise presents a more likely path of US net liquidity, taking into account several assumptions. While we understand the complexity and multiple variables involved, the purpose is not to provide precise estimations but to offer a directional approximation of macro conditions over the coming months.
The assumptions for this exercise are similar to the previous one, with some modifications. They are as follows:
- The issuance of new treasuries is set to commence during the week of 6/7, with flexibility for potential changes.
- Quantitative tightening (QT) continues at a rate of $95 billion per month.
- The Reverse Repo Program (RRP) balance remains unchanged, except for funding new treasury issuances.
- The total new issuance, including bills and coupons, amounts to $733 billion, with a front-loaded distribution gradually decreasing until 8/31.
- Funding sources shift from bank reserves to a combination of bank reserves and the RRP as rates spike and capital is withdrawn from money market funds (MMFs) parked in the RRP.
- It is assumed that the treasury will utilize the Treasury General Account (TGA) in $50 billion weekly increments to meet federal government obligations.
Based on these assumptions, the result below depicts an initial significant drawdown in net liquidity, which swiftly recovers as the treasury begins spending the raised capital and as rates become attractive enough for RRP capital to participate in funding.
It is important to reiterate that this is an illustrative exercise and not a precise prediction. We anticipate that any temporary dips in liquidity are likely to be transitory in nature. This exercise provides an approximation of the broader direction that macro conditions are expected to take in the coming months.
To reiterate our view on how to position around the debt ceiling:
- In the scenario of no deal or an increased probability of technical default, we anticipate a narrative-driven rally for Bitcoin. The market would likely price in the necessity of intervention by the Federal Reserve to stabilize the market, resulting in assets repricing accordingly. However, we believe that a “no deal” situation would not persist for an extended period, as it would ultimately compel both sides of the debate to reach a resolution sooner rather than later. The rally in Bitcoin would likely be of a similar duration.
- In the case of a deal which aligns with our base case, we anticipate a short-term drawdown in risk assets. However, following this initial decline, we expect a resurgence in these assets, driven by a return to the current levels of bank deposits.
Variables that Might Change our Near-Term Views
Hong Kong (Re)Entering the Area in A Bigger Way than Anticipated = Bullish
The recent approval of crypto trading for retail investors by Hong Kong regulators starting on June 1st could have a notable impact on crypto prices. Exchanges will be required to establish robust onboarding processes, disclose information about investable assets, and adhere to strict criteria for listing and trading. The available assets are likely to focus on larger-cap assets with high liquidity and lower susceptibility to market manipulation.
The Securities and Futures Commission of Hong Kong has already granted licenses to OSL and Hash Blockchain, among other digital asset platforms that may already be engaged in offshore trading. This decision reflects Hong Kong’s efforts to attract crypto-related businesses and position itself as a prominent hub in the crypto industry.
While this move surprises some observers due to Hong Kong’s close ties to China and China’s historically stringent stance on cryptocurrencies, it carries significant implications. The market may experience increased liquidity, benefiting participants, and there will be heightened attention to market activity during non-U.S. trading hours. Additionally, the monetary policy of the People’s Bank of China (PBOC) is expected to gain macroeconomic importance due to its influence on capital flows in Hong Kong.
If Hong Kong, heavily influenced by PBOC policy, becomes more actively involved in crypto participation, the stimulative monetary policies of the PBOC could offset or nullify the liquidity drawdown described in the United States. This outcome would be regarded as a bullish development.
A Continuation of Rate Hikes = Bearish
While our base case continues to lean towards a pause at the June Federal Open Market Committee (FOMC) meeting, anticipating a stabilizing effect on rates and a boost to collateral values in the broader financial ecosystem, recent market activity has shown a shift towards a more balanced outlook regarding the likelihood of an additional 25 basis points rate hike in June.
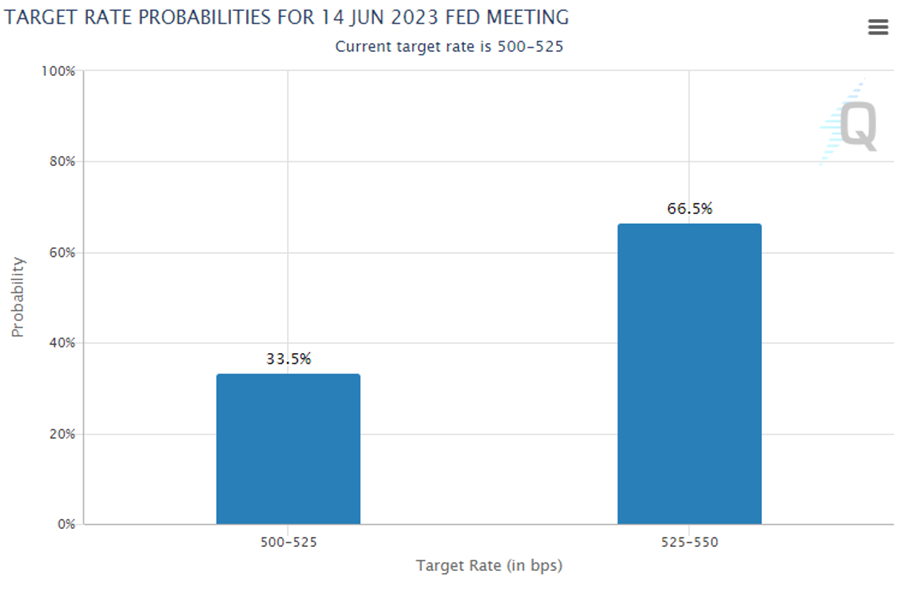
It is important to note that if the Federal Reserve is unable to pause as anticipated, it could potentially amplify the impact of treasury issuance on the market. This would occur due to a continued increase in the overnight rate, thereby making it more challenging to attract capital from the Reverse Repo Program (RRP) for bidding on newly issued treasury bills.
Of course, they are all significant these days, but the May CPI release in June should be fun.
Bottom Line Regarding Positioning Ahead of Debt Ceiling Decision: To summarize our views on the debt ceiling, in a “no deal” scenario, we expect a narrative-driven rally in Bitcoin, while a deal would likely lead to a short-term drawdown in risk assets followed by a resurgence as bank deposits normalize. Two factors that could impact our near-term views are the potential participation of Hong Kong in crypto, which could offset the liquidity drawdown and be viewed as bullish, and the impact of an additional rate hike without a pause from the Fed, which is seen as bearish.
Core Strategy
Despite our recommendation in late April to raise cash in anticipation of a near-term resolution to the debt ceiling (TGA refill = lower market liquidity) and recent negative price movements, our overall outlook for the year remains positive. If the Federal Reserve follows through with a pause, it would be a positive development for assets sensitive to liquidity conditions.
Tickers in this report: BTC -4.54% , ETH -5.26% , RPL, MATIC, SOL