
Holding the Line

Key Takeaways
- It was a tough week for the bulls as yields did not roll over as many anticipated, leading to a lack of follow-through in the crypto spot market.
- Futures contracts were priced at their highest levels since April of last year, and perp funding rates were at their highest levels since late 2021. Consequently, many traders were caught offside.
- The market continued to reprice rates higher this week on the back of continued hawkish sentiment from the Fed and relatively hot inflation data. The market is notably no longer pricing in rate cuts for 2023.
- After examining hourly returns, we note that BTC has underperformed during Asian trading sessions in comparison to US trading hours since the start of this year. However, we posit that this does not negate the positive tailwinds that BOJ and PBOC liquidity provide to the crypto market.
- We maintain the asymmetry from here remains to the upside in 1H and that this dip is worth buying. The lack of retreat in crypto prices relative to the increase in yields over the past few weeks is quite impressive. We think this is a function of investor composition, improving global liquidity conditions, and a market for risk assets that have already experienced the worst of the ongoing tightening cycle.
Bulls Out Over Their Skis in the Short Term
This was obviously a disappointing week for the bulls. We have yet to see the rollover in yields that we were anticipating in the near term, and as a result, crypto is starting to catch up with global equities.
We can see below that an apparently overzealous derivatives market exacerbated the lack of follow-through in the spot market. Below we map out bitcoin’s 3M basis and annualized perps funding rate.
Futures contracts were being priced at the highest level since April of last year, and perp funding rates were at their highest levels (in aggregate) since late 2021. As was required just a few weeks ago, it will likely require some of these unhealthy longs to be sidelined before we head higher.

Source: Fundstrat, Glassnode
Market Reprices Rates
As mentioned above, we have yet to see yields start to retreat. This was likely attributable to continued hawkish dialogue from Fed officials on the back of additional hot inflation data. This week, the inflationary data came in the personal consumption expenditure index, which increased 0.6% since last month, higher than analyst estimates.

Consequently, the futures market continued to reprice risk-free rate expectations higher, putting incremental downward pressure on risk assets.
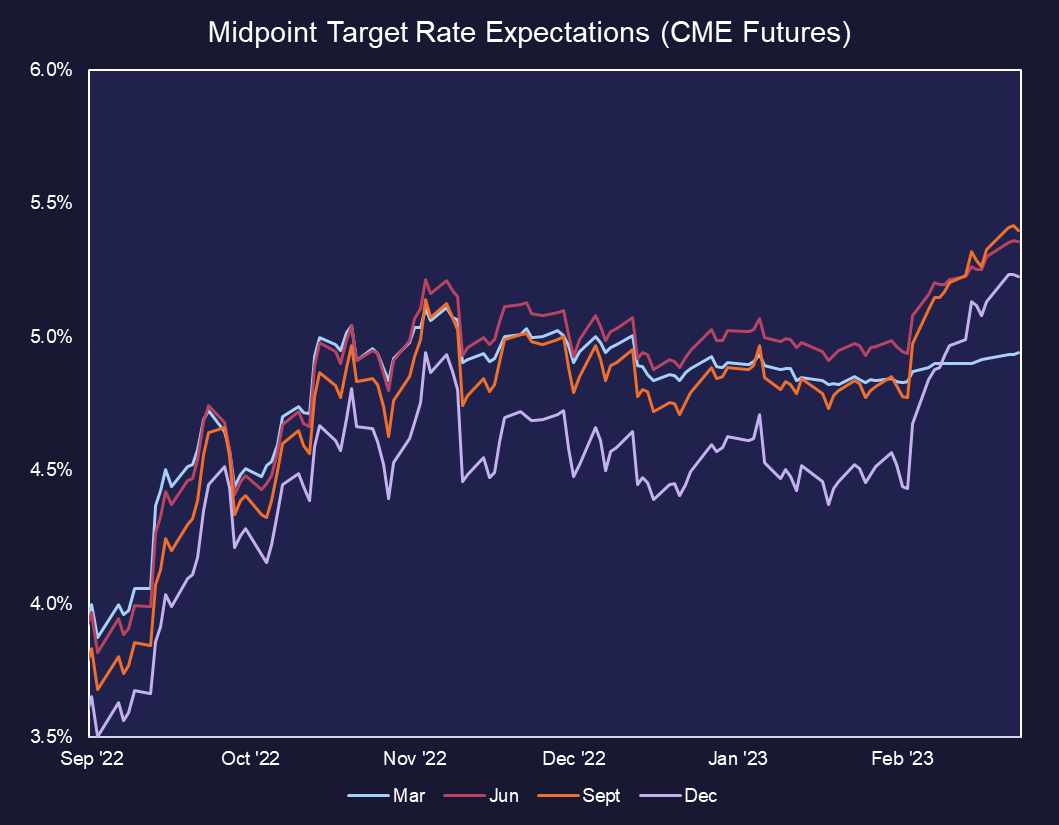
Source: Fundstrat, CME Group
Interestingly, by the end of the week, the market had priced out the likelihood of a rate cut before the end of the year.

Source: Fundstrat, CME Group
As mentioned last week:
- This trend is a near-term headwind for risk assets. If rate expectations continue to climb, the ceiling for broader risk assets could be lowered in the near term.
- BTC -2.72% , ETH -5.16% , and other large-cap cryptoassets’ performance, despite these headwinds, is encouraging and sets us up nicely for a bounce on any encouraging data/relief in rates.
Where We Are Compared to Prior Cycles
Bitcoin is a cyclical animal for several reasons. Among them are:
- Cyclical changes in the global macro environment.
- The programmed halvening approximately every four years.
- The general reflexivity of bitcoin’s price, which shifts supply from the missionaries at cycle lows to the mercenaries at cycle highs, and back again (arguably the most crucial variable for forming cycle lows).
As our clients and subscribers are aware, we are of the view that we reached the prior cycle lows in November of last year, have climbed the post-FTX wall of worry, and are at the start of a brand-new cycle. With that in mind, we have yet to see a cycle low that was not followed by ample opportunities for investors to make sizeable returns within the first 365 days following that low. While many investors might be looking at January’s rally as overly frothy or perhaps the lone opportunity for returns this year, we point to the chart below to demonstrate how much of an anomaly this would be and how the bitcoin’s cyclicality suggests further price appreciation in the coming months.
Of course, not all cycles are built the same, and past returns are not guarantees of future results, but this should at least provide perspective to those who think the top is in for BTC this year.
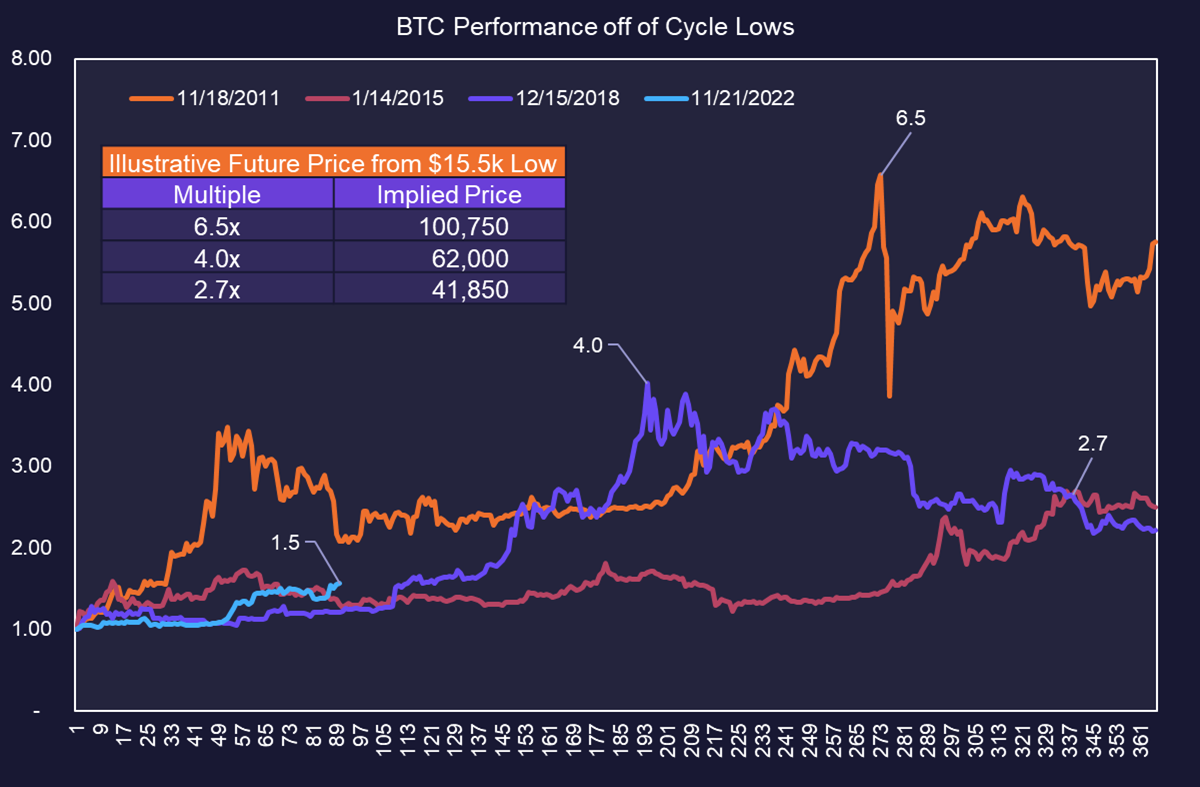
Source: Fundstrat, Glassnode
Reiterating Global Liquidity Outlook
Last week, we dove into the current state of global liquidity, noting that the conditions for risk assets in 1H were better than many people realize. As a reminder, the rationale was supported by the following reasons:
- The rate of change in domestic liquidity has likely bottomed. This doesn’t mean the terminal rate won’t go higher or stay there for longer, but the greatest shock to the system has already been observed.
- Net liquidity is more important than total Fed balance sheet assets. As we have alluded to in prior notes, the debt ceiling impasse has led us to a situation in which the treasury will not be able to issue new debt for the next couple of months and thus needs to draw on its bank account with the Fed to pay its bills. Further, in concert with our point above, a Fed that is slowing its tightening process could lead to an observable decrease in bond market volatility. Lower bond market volatility could very well result in capital being pulled from the $2 trillion reverse repo facility and consequently increase net domestic liquidity.
- Asia has capitulated. As noted above, crypto is particularly sensitive to changes in overall global liquidity. At the start of the bear market, the Fed was in the driver’s seat for dictating global liquidity conditions. They were hiking rapidly while the rest of the world was playing catch-up. Now that the Fed has arrived at the point where they are at least considering pausing, their power over markets is still strong but comparatively muted.
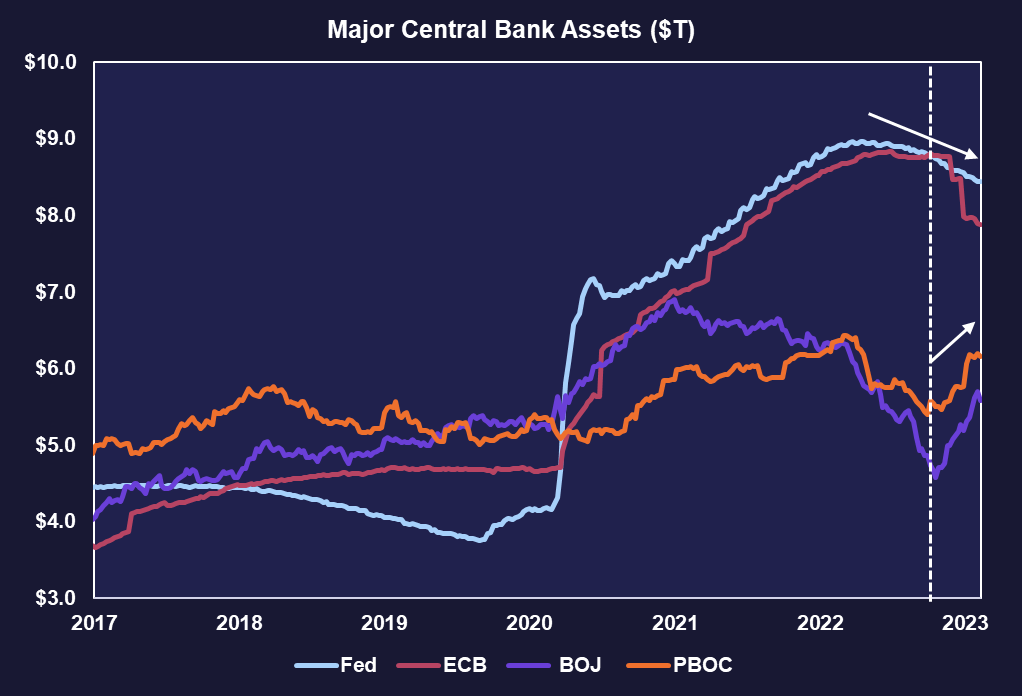
Source: Fundstrat, Bloomberg
Examining BTC Performance During Regional Trading Hours
The increase in global liquidity led by the east made us wonder how bitcoin has been performing during different regional trading sessions.
Thus, we created composites of bitcoin’s performance during the four global forex trading sessions – the US, UK, Japan, and Australia. Contrary to what the chart above might suggest, since the start of the year, performance has been the best during US hours, followed closely by the UK and Australia. Performance during the hours of the Tokyo desk was, remarkably, the least impressive.
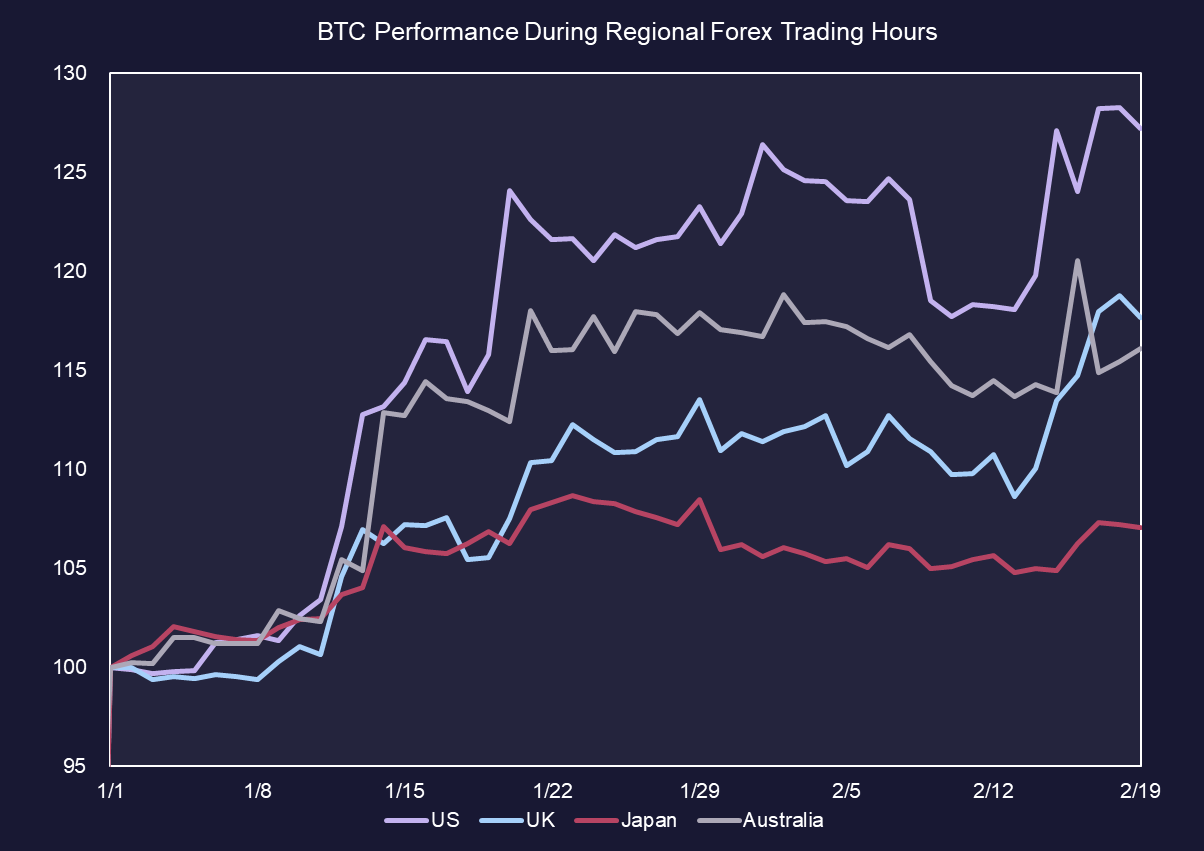
Source: Fundstrat, TradingView
As further evidenced on a per-hour (GMT) breakdown, the average returns are noticeably higher, on average, during US trading hours. We note that the hour between 24 and 1 GMT is quite impressive and think this is due to an outlier 2% candle experienced towards the start of the year.

Source: Fundstrat, TradingView
This underperformance during Asian trading hours relative to the rest of the world obviously raises the question – is Asian liquidity really influencing the crypto market?
In short, yes. Liquidity isn’t necessarily siloed. Japanese citizens can purchase overseas equities in the same way that Americans can. An increase in global liquidity offers an overarching buffer to risk assets.
More importantly, and this is challenging to quantify, but regional trading differences are often more reflective of small retail trader participation. These retail traders are less immediately responsive to changes in central banking policies. The average basement trader slinging $50 million market cap alts is unlikely to examine the open market purchases of the BOJ or PBOC.
Larger funds and institutions will favor trading during the hours of the day that are most liquid and thus will offer the best prices for their bids. We think the greatest “size” will look to trade during the most liquid hours (normally US market hours) of the day, regardless of location.
In short, we think that an Asian macro fund looking to put on a long position in bitcoin on the back of increasing global liquidity would be unlikely to show up in hourly pricing data.
Strategy
We think the asymmetry form here remains to the upside in 1H and that this dip is worth buying. The lack of retreat in crypto prices relative to the increase in yields over the past few weeks is quite impressive. We think this is a function of investor composition, improving global liquidity conditions, and a market for risk assets that have already experienced the worst of any historical tightening shock last year.
