
Hitting the Debt Ceiling and the Buy Button

Key Takeaways
- A sharp increase in spot and futures volumes has been a welcome sight for crypto investors. A plummeting skew suggests that investors who missed the pump over the past few weeks may be compensating for lost time by piling into call options.
- Encouraging on-chain data, including an increase in realized cap and SOPR, suggest capital inflows into the bitcoin network and increasingly bullish sentiment among existing holders.
- We dive into the prevailing market liquidity conditions, discuss the potential effects of the debt ceiling on these conditions, and examine the potential impact on crypto prices.
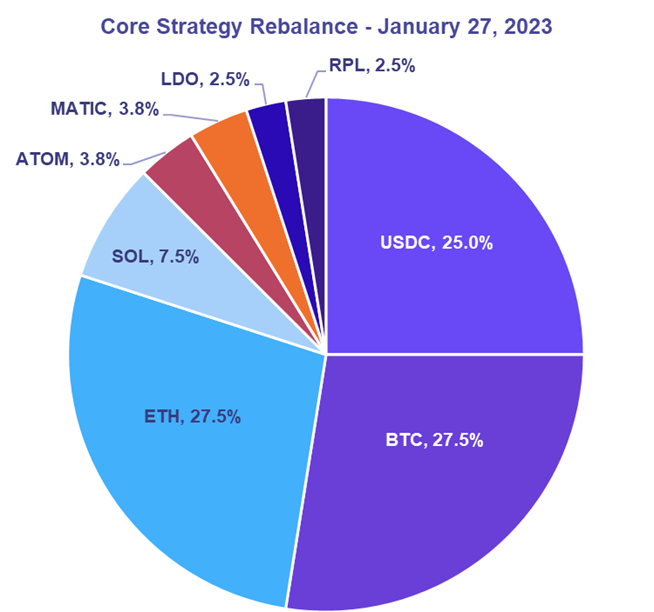
- Strategy - In the matter of a week, we have seen (1) Genesis file for bankruptcy with a prepackaged offering to creditors, which indicates a lack of imminence in any potential forced selling from assets tied up in the larger DCG entity, and (2) the debt ceiling be reached, and an apparent impasse between legislators form, suggesting that despite the potential for tough talk out of the FOMC, liquidity conditions should be more favorable for risk assets over the next few months than they otherwise should be. With that in mind, and with the understanding that there is still risk in longing a crypto market that remains somewhat unsubstantiated by on-chain activity, we are reducing our Core Strategy stablecoin exposure to 25% and increasing allocation to other crypto assets pro rata.
Back to Life
If you were 100% deployed on January 1st and decided to lock in your returns for the year, frankly, we wouldn’t blame you, especially not after the carnage witnessed last year. However, as we discussed last week, we view this current rally as a sign of more opportunities to come and are excited to help our clients navigate the crypto market in 2023.
The choppy, directionless crypto market sprung to life just a couple of weeks ago, with spot volumes ticking noticeably higher. Given the prevailing liquidity conditions, it did not take an enormous amount of spot volume to inject some volatility into the market.
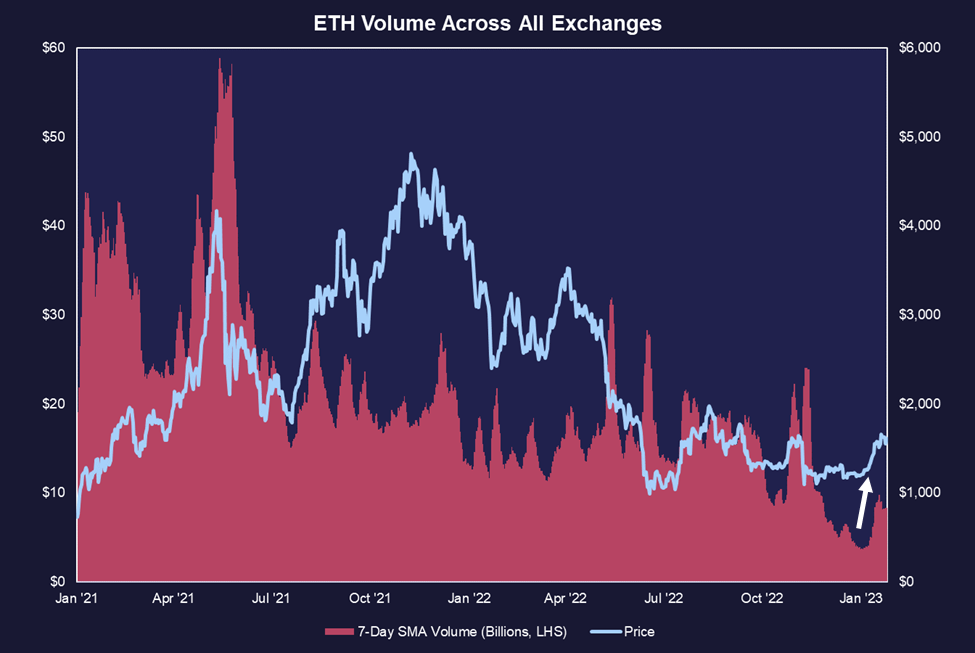
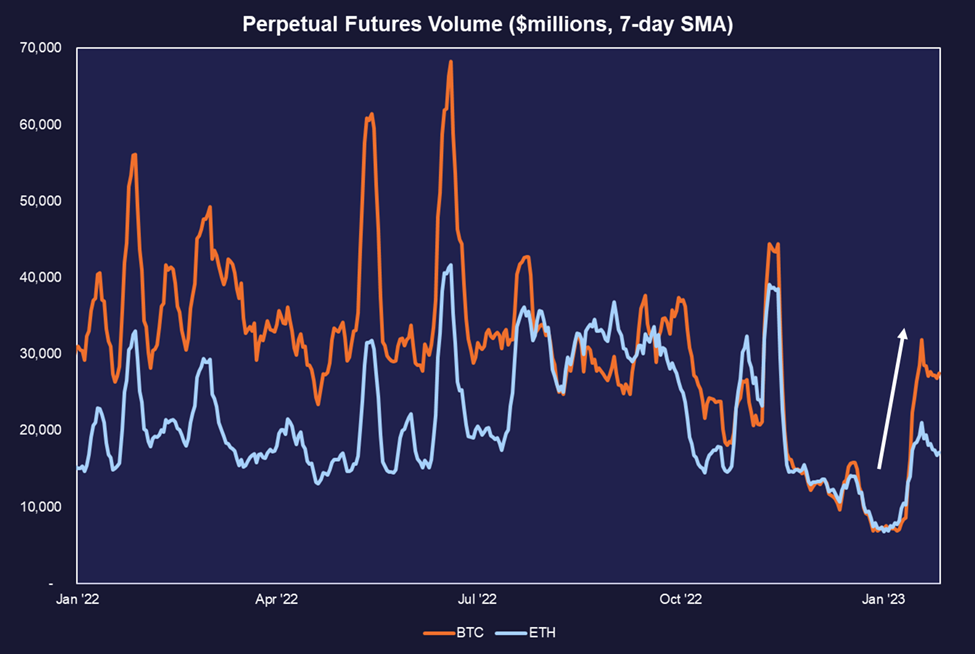
Below we see a parabolic rise in perpetual futures volume starting a couple of weeks ago. While we are yet to see the same volumes witnessed in 2021, this spike in activity is a welcome sight for crypto investors.
FOMO in the Options Market
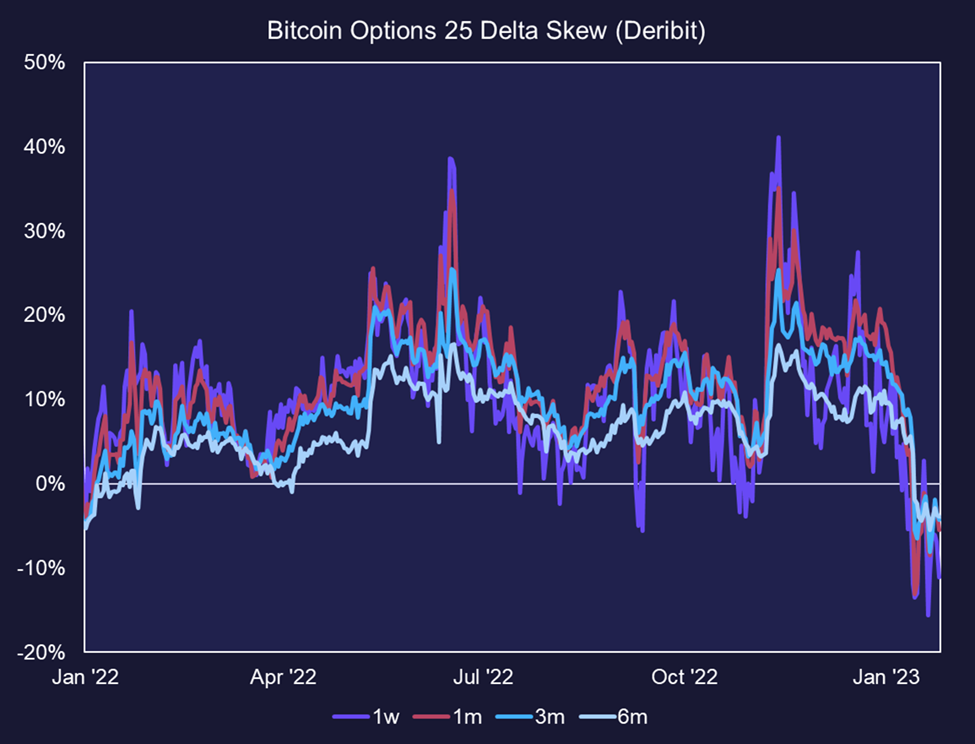
The 25-delta skew is a metric that compares the relative value of put options and call options in the market. It is determined by comparing the implied volatility of 25-delta put options to the implied volatility of 25-delta call options, which is then normalized by the at-the-money implied volatility.
This metric helps to understand the market’s perception of risk and implied volatility for options with different expiration dates. A negative delta skew can indicate a bullish market, suggesting that put options have higher implied volatility than call options due to increased demand for them.
A plummeting 25-delta skew indicates that traders are piling into call options as the implied volatility of call options is increasing relative to the implied volatility of put options. The chart suggests that investors who missed the pump over the past few weeks may be compensating for lost time by piling into call options.
Realized Cap Increasing for the First Time in a Long Time
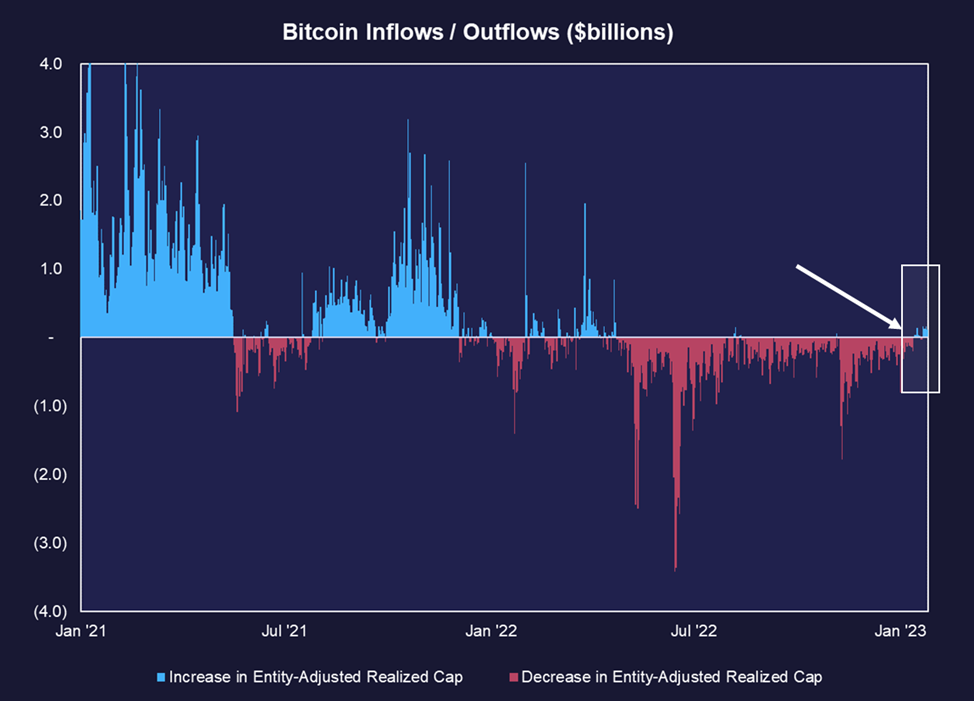
Realized cap is a metric that values each unspent transaction output (UTXO) in a blockchain network based on the price at which it was last moved rather than its current market value.
A coin that was last moved at a lower price and is now spent at a higher price will increase the realized cap, while a coin spent at a lower price will decrease the realized cap. Realized cap can be considered a proxy for the value stored or saved in the asset and thus can be viewed through a framework of inflows and outflows into/out of the network.
While the change in trend observed below is small in magnitude, the interruption of a long streak of outflows is difficult to ignore. This is a very encouraging sign that more capital is flowing into the space on the back of the recent rally.
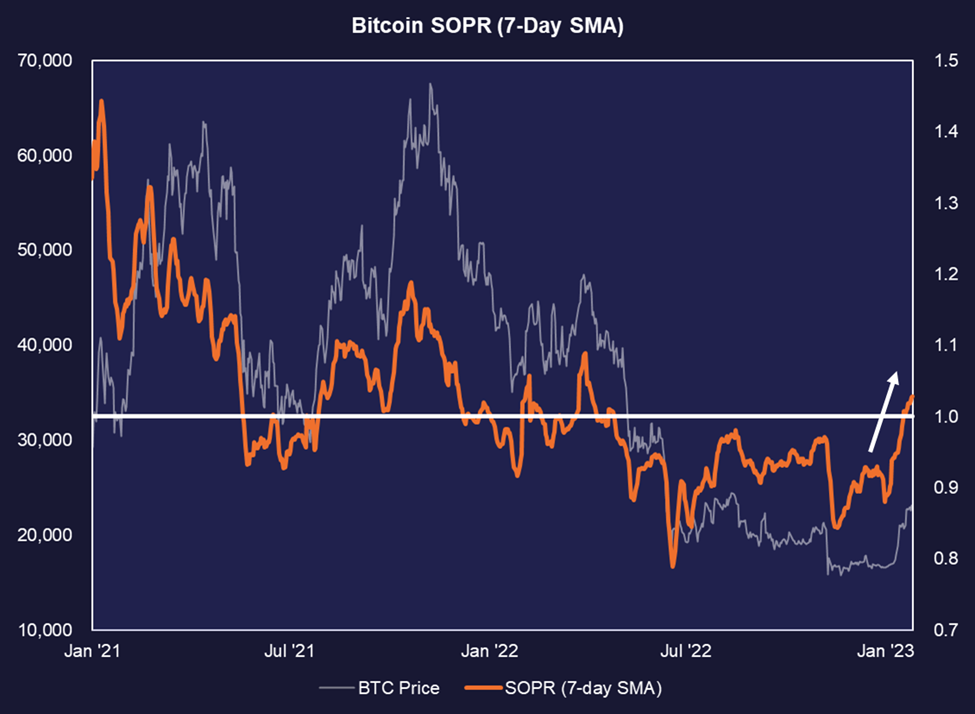
SOPR Displays Strong Momentum Signal
The SOPR (Spent Output Profit Ratio) is a metric that measures the average profit or loss of coins that have been moved on a given day. A value greater than 1 indicates that the coins are being sold at a profit, while a value less than 1 indicates they are being sold at a loss. A trend of increasing SOPR suggests that profits are being realized and potentially illiquid coins are becoming liquid again. A trend of decreasing SOPR suggests that losses are being realized and/or profitable coins are not being spent.
As we can see in the chart below, SOPR has trended sharply higher, an indication that investors are (1) finally starting to realize profits and (2) many are holding onto their BTC to sell at higher margins instead of capitulating early. This is a strong sign that bullish momentum may be returning to the market.
Debt Ceiling Implications for a Liquidity Sink
After falling on its face in the presence of CPI inflation, many bitcoin advocates have been relentlessly searching for a new way of articulating the network’s utility. Strict monetarists became overly obsessed with the scarce attributes of bitcoin’s supply schedule and, as a result, drew a direct connection between its conservative monetary policy and its value. However, it is our view that this emerging network’s best attribute is not necessarily its strict adherence to a capped supply but rather its resistance to censorship.
In fact, if every node on the network agreed to update the bitcoin software to increase the supply by 2x, it would not be the catastrophic event many imagine it would be. No centralized actor would be enforcing those changes, and therefore the network would be operating as intended. That said, we do not anticipate any user-activated soft forks that feature such changes to occur anytime soon, mostly because that would harm the price of the native asset of the network and, therefore, would not make sense.
As we have said many times before, it’s appropriate to think that BTC continues to perform relatively well during periods of loosening monetary conditions and experience contractions during periods of tightening monetary conditions (all else being equal). This is because it is still relatively nascent money that behaves in line with emerging markets, tech stocks, and other assets with a similar distance from the US dollar on the risk curve.
In many ways, we can think of BTC acting as a liquidity sink (or, for those looking for a narrative to attach to, a hedge against asset inflation). With that in mind, it is worth diving into the recently changing dynamics in market liquidity that have come to light because of the debt ceiling impasse.
A Note on Private Market Liquidity
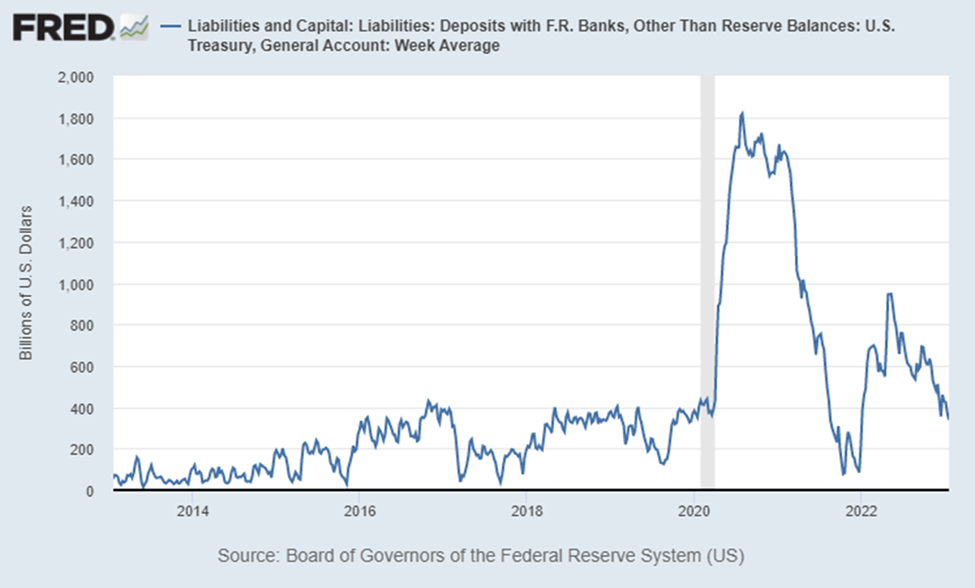
At a high level, we have understood that the Fed can inject money into the economy via quantitative easing (bond purchases = Fed assets up) or quantitative tightening (bond sales = Fed assets down). However, after the unprecedented doubling of the Fed balance sheet in 2020, two additional components of the market liquidity apparatus started to hold greater importance in determining the amount of liquidity available for the private sector to deploy into assets. These were the Treasury General Account and the Reverse Repurchase Facility (RRP).
- The Treasury General Account (TGA) is a government account held by the U.S. Department of the Treasury. It is used to manage the government’s cash balance and to make payments to various entities, such as government contractors, Social Security beneficiaries, and other federal agencies.
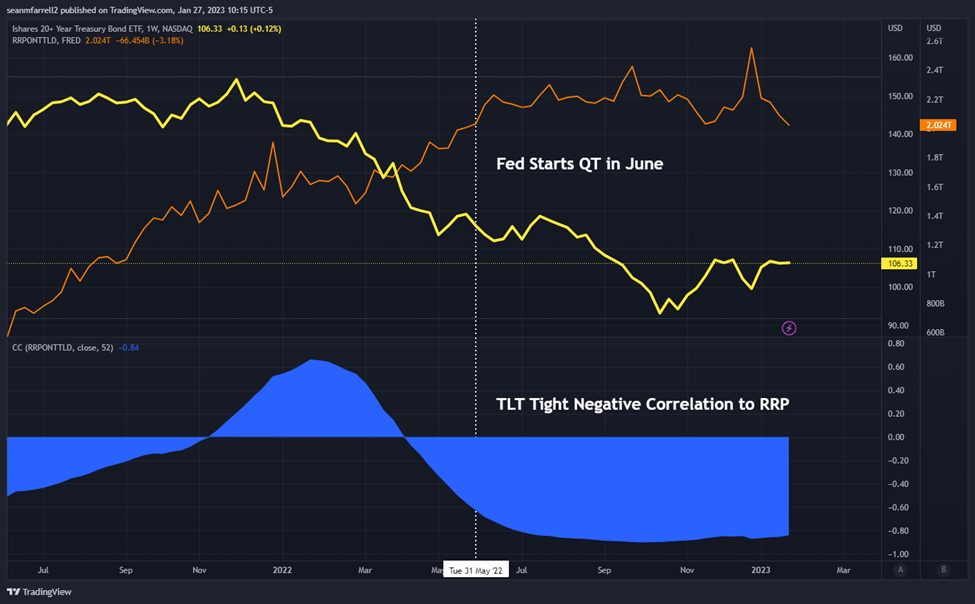
- The Reverse Repo Facility (RRP) is a tool used by the Federal Reserve to control overnight interest rates by decreasing the number of reserve balances in the banking system through reverse repo transactions. In a reverse repo transaction, the Fed sells securities with the agreement to buy them back later, providing an alternative investment option for money market investors when rates fall below the interest on reserve balances rate. The RRP helps support the Federal Reserve’s monetary policy goals and financial system stability. When there is too much capital chasing short-term rates, and they fall below the rate offered by the RRP, inflows into the RRP will increase, and vice versa.
- Private Market Liquidity (or Net Liquidity) is everything that is left over in the economy. This is the denominator for all financial assets that we are concerned about.
Therefore, in assessing market liquidity conditions, we are unable to merely isolate the number of dollars in the economy as a measure of financial conditions. We must contemplate how many of these dollars are available to the private sector, how many are in the Treasury’s bank account with the Fed, and how many are pulled out of the economy by entities looking for better overnight yields in the RRP.
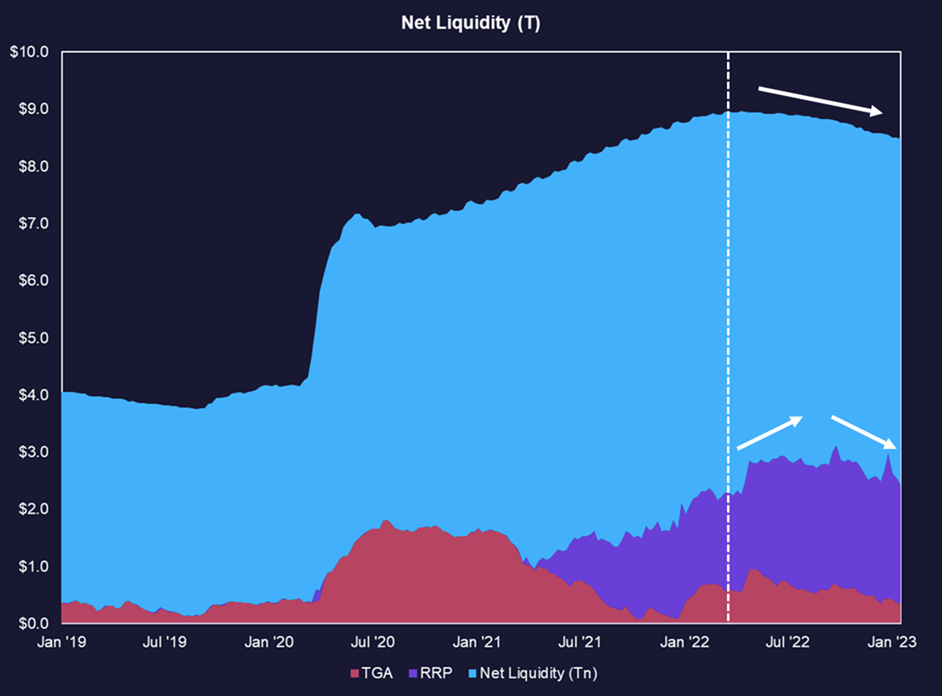
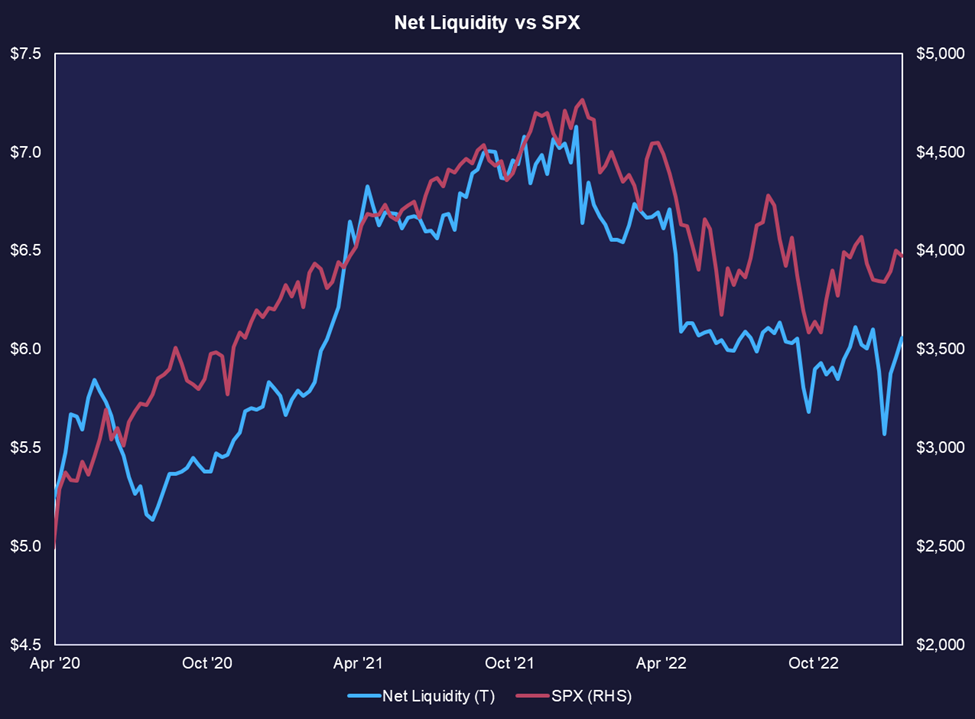
As we can see below, despite the Fed beginning to let debt on its balance sheet mature, effectively engaging in QT as of Q2 2022, the actual amount of liquidity available to the private market (net liquidity) fluctuated depending upon the amount of liquidity siphoned out of or injected into the economy by the TGA and RRP.
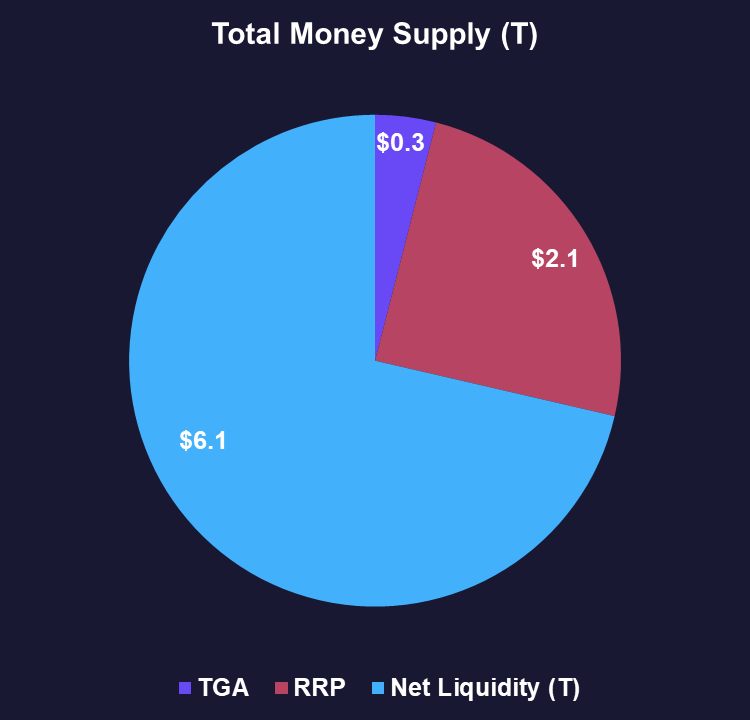
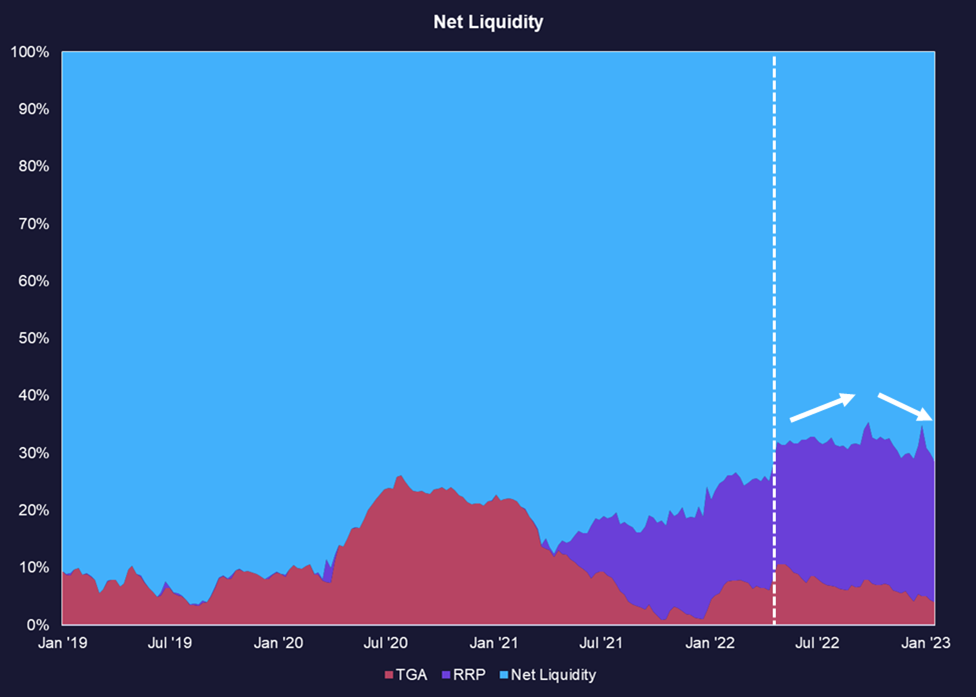
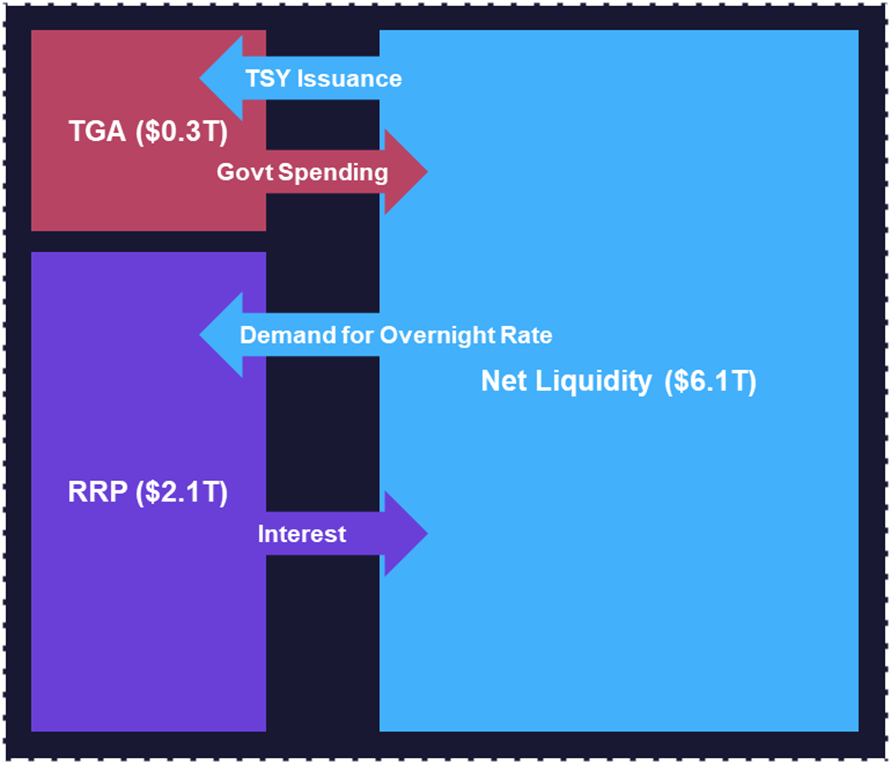
Below is another helpful representation of how this pie is sliced and the resulting effects on the net liquidity available to the private market.
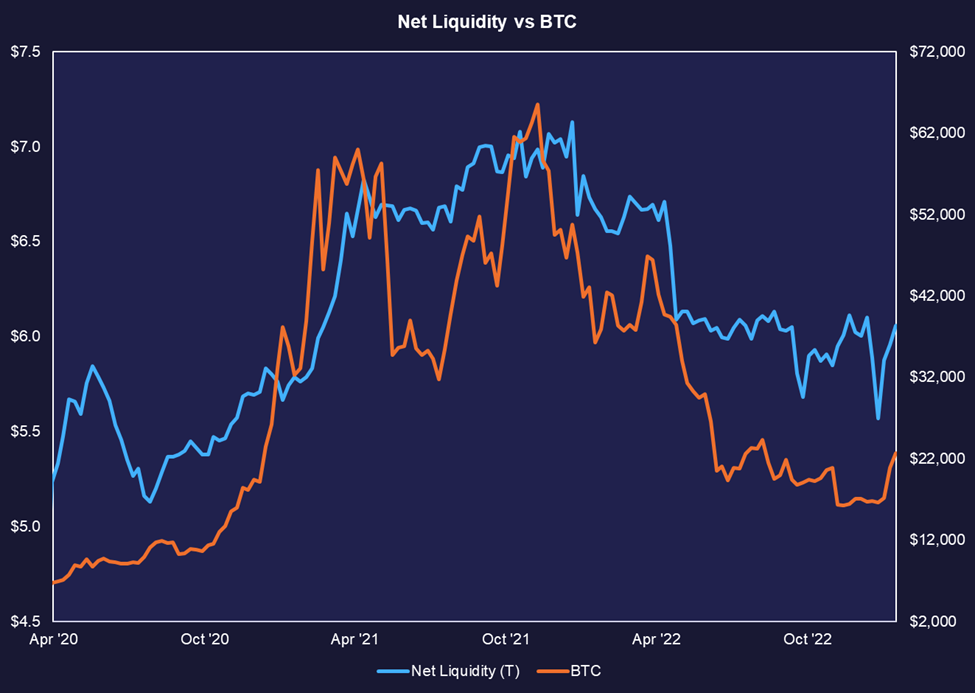
As one would expect, the SPX and BTC have tracked this net liquidity metric tightly over the previous couple of years. Thus, one should expect any future increases in market liquidity to lead to more favorable conditions for risk assets.
At this point, we are sure you are wondering what this all has to do with the debt ceiling.
Well, first, let’s more acutely define the flows between major liquidity components. The economy is an enormously complex machine, but the levers always boil down to supply and demand. Below is a demonstration of liquidity flows between components of the Fed balance sheet. The relationship we are concerned about at the moment is the one between the TGA and Net Liquidity. As the figure suggests, liquidity migrates from the TGA to the private market via government spending, and it returns in the form of treasury issuance.
Last week, Treasury Secretary Janet Yellen announced that the Treasury Department would start to take “extraordinary measures” to avoid default on the national debt after the United States reaches its debt limit. Yellen reassured the public that the government would continue to pay its bills and honor its debts but said that it might be necessary to prioritize certain payments in the short term in order to avoid default.
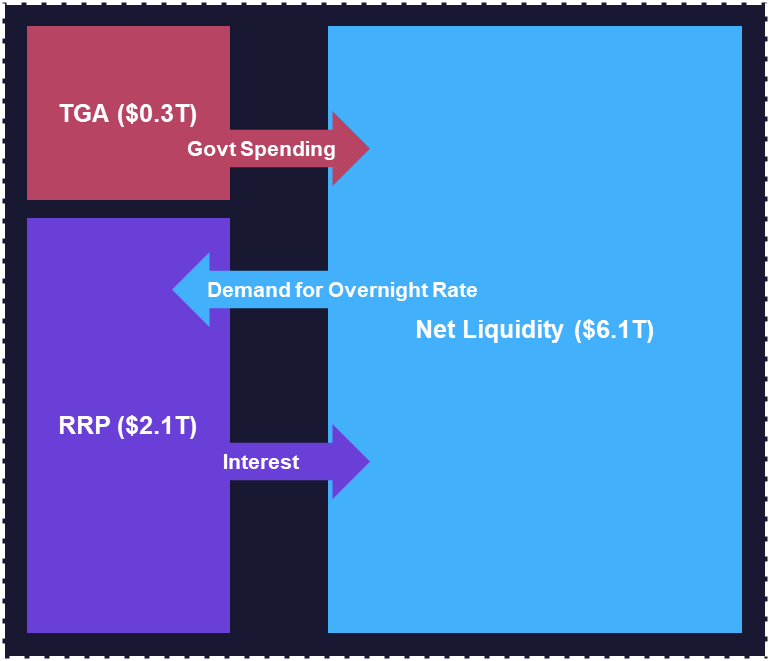
What does this mean for our graphic above?
Well, since the US government is no longer able to issue new debt, the top arrow disappears, and there is a one-way flow of liquidity from the TGA into the economy as the Treasury starts to draw on the TGA to pay its obligations in the private sector.
In fact, liquidity from the TGA has flowed back into the economy for the better part of Q3 and Q4 of 2022. Unfortunately, bitcoin was subject to some idiosyncratic risks in late 2022 and thus could not fully benefit from the increased liquidity in the economy and other risk assets.
There is the natural concern that liquidity simply flows into the RRP to negate the effects of the emptying of the TGA, especially since a lack of new treasury issuance should theoretically put a ceiling on rates. However, as our macro team has astutely pointed out in recent months, the bond market across most durations and risk profiles has started to catch a bid based on the view that we are beyond peak tightening. Thus, easing financial conditions will cause much of the capital tied up in short-duration debt instruments like the RRP to search for higher yield elsewhere in the economy.
Core Strategy Rebalance
Last week, we delivered our annual outlook. Taking last year into context, we were super bullish, taking the view that BTC would reach $35k – $44k and ETH would move to $2,400 – $3,200 at some point this calendar year.
We also discussed some of the critical narratives we will be watching in 2023, including anticipation of the next BTC halvening, the upcoming Shanghai upgrade enabling staking withdrawals, and EIP 4844 leading to increased value accrual at the Ethereum scaling layer. These narratives have informed our allocation to select altcoins.
Despite our view that the absolute lows for the majors are in, we still believed there were some near-term risks to remain cognizant of. These included:
- Additional fallout from DCG
- One more swipe at risk assets at the next FOMC meeting (scheduled for next Tuesday)
- The ongoing on-chain bear market
For the reasons highlighted above, we maintained that a 50% weight on stablecoins was appropriate. However, in the matter of a week, we have seen the following:
- Genesis filed for bankruptcy with a prepackaged offering to creditors, which indicates a lack of imminence in any potential forced selling of assets tied up in the larger DCG entity.
- The debt ceiling was reached, and an apparent impasse between legislators formed, suggesting that despite the potential for tough talk out of the FOMC, liquidity conditions should be favorable for risk assets over the next few months.
With that in mind, and with the understanding that there is still risk in longing a crypto market that remains somewhat unsubstantiated by on-chain activity, we are reducing our stablecoin exposure to 25%, rebalancing our total allocations to liquid staking providers to 5% and increasing allocation to remaining crypto assets pro rata.
Tickers in Report: BTC -0.34% , ETH -0.40% , LDO, RPL, ATOM -11.36% , SOL, MATIC, USDC