


Portfolio Yield Strategies

Key Takeaways
- For those looking to amplify the returns of their long positions, this issue of DeFi Digest strives to cast light on some of the best risk-adjusted yields in DeFi. The resulting simulated portfolio is a $1m mix of BTC, ETH, Alternate Layer 1/2s, and Stablecoins.
- We then use TVL to ascertain from which chains to farm yield, with a slight bias towards lower TVL chains due to their nascency. While the returns from this diversified portfolio are not competitive with pure-play yield-farming strategies, the ultimate goal of the strategy described here is to provide the best risk-adjusted yields for an existing portfolio of assets to complement absolute returns.
- Through the simulated portfolio, we project 26.4% annualized returns on $1m initial investment, diversified across trading fees, dApp protocol emissions, Layer 1 PoS emissions, and option vega harvesting. The portfolio weights constitute a weighted beta of 0.90 against BTC, corresponding to 71 days for the strategy to recoup IL from a 50% decline or 2x move from BTC.
- Some of the protocols include GMX on Arbitrum and Avalanche, Velodrome Finance on Optimism, Thena Finance on BNB Smart Chain, Uniswap v3 on Polygon, Pangolin on Avalanche, Ribbon Finance on Ethereum, and Pendle Finance on Optimism.
Fundstrat’s recently launched Crypto Core Strategy offers subscribers a digestible tool to manage their crypto portfolio, with the goal of outperforming bitcoin. For those looking to amplify the returns of their long positions, this complementary issue of DeFi Digest strives to cast light on some of the best risk-adjusted yields. We first describe our methodology to filter for yield opportunities, then dive into the protocols offering the yields, and describe some metrics to gauge return and risk.
Methodology
While DeFi Digest does not venture to offer views on directional risk (our Crypto Core Strategy is best suited for this), we leverage market capitalization to offer some guidance on what an index (or average) portfolio might look like, then Total Value Locked (TVL) for the desired amount of exposure to each chain. The resulting simulated portfolio is a $1m mix of BTC -1.70% , ETH -0.47% , BNB, MATIC, AVAX, OP, and Stablecoins.
Figure: Portfolio Exposure Breakdown
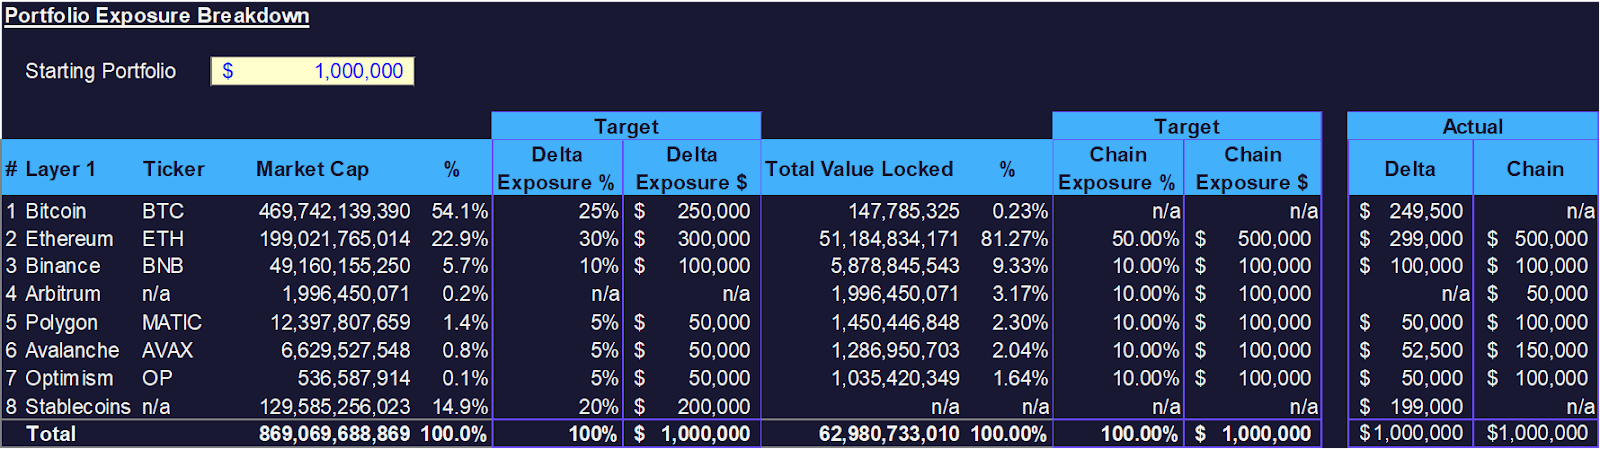
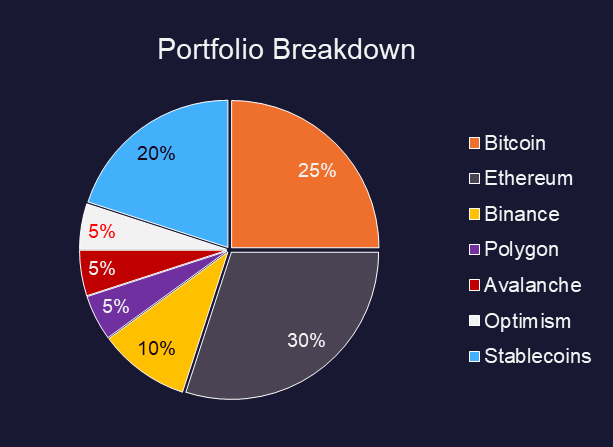
Figure: Portfolio Exposure Visualized
Then, we use TVL to ascertain from which chains to farm yield, with a slight bias towards lower TVL chains due to their nascency. This is because newer chains do not yet have the de facto DeFi pillars (lending, DEX, aggregators, etc.), hence, they typically host newer protocols that want to attract farmers with higher yields. We further filter liquidity pools to only include TVL of greater than $1m, and audited protocols, and then attempt to diversify across yield sources. Lastly, the APRs distributed below represent 90-day medians to best reflect accuracy and sustainability, unless otherwise stated.
While the returns from this diversified portfolio are not competitive with pure-play yield-farming strategies, the ultimate goal of the strategy described here is to provide the best risk-adjusted yields for an existing portfolio of assets to complement absolute returns. Subject to reader demand, we will write about pure-play yield farming strategies (typically found in delta-neutral portfolios) in a future issue.
Protocols (Network)
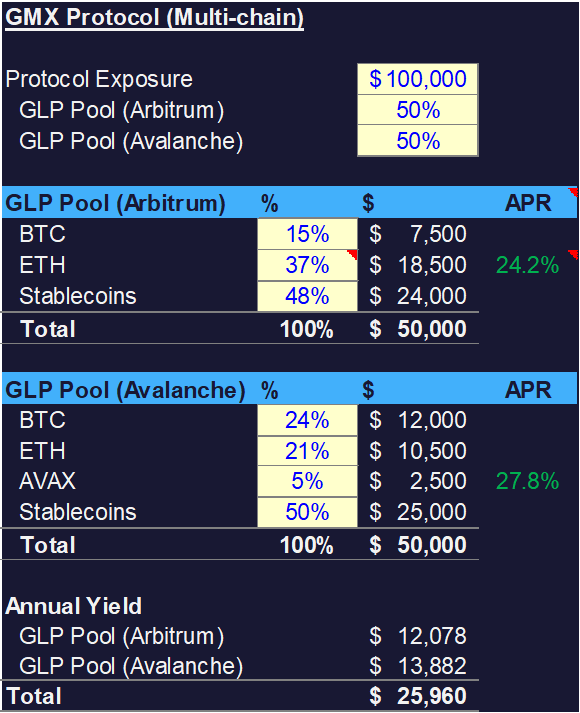
GMX Protocol (Arbitrum, Avalanche)
For a refresher on GMX, we previously covered the protocol and its mechanics against its competitors in Z2O – Decentralized Perpetual Futures. GMX offers high real yield through GLP, a liquidity pool index composed of BTC, ETH, and stablecoins that serve as prime collateral to GMX traders. We allocate $100k to GLP pools, split equally between that of the Arbitrum and Avalanche network.
Due to GLP’s wide use as prime collateral, other protocols such as Plutus and JonesDAO have also built atop the liquidity index token.
Given that the returns stem from trading fees (we conservatively omit esGMX returns), the ~25% yields on GLP across BTC, ETH and stablecoins are quite compelling. One of the major risks GLP holders assume is taking the other side of taker’s trades, but this risk in our opinion is fairly subdued given GMX’s lindy effect and increased safeguards on maximum position sizes.
Figure: GMX Protocol Allocation (GLP Pool)
Velodrome Finance (Optimism)
Velodrome Finance is the top DEX on Optimism by TVL ($313m), trumping ‘DeFi 1.0’ protocols like Synthetix, Aave, and Curve. The protocol is inspired by Solidly Financed launched by Andre Cronje, who incorporated ve-tokenomics and ve-NFTs to attract liquidity on both stable and volatile LP pairs. One of the core improvements of Velodrome/Solidly over Curve is that gauge voters can only collect fees from the pools to which they direct emissions. This aligns protocol emissions with fees generated, instead of just liquidity.
Figure: Velodrome Finance Allocation (OP-USDC Pool)
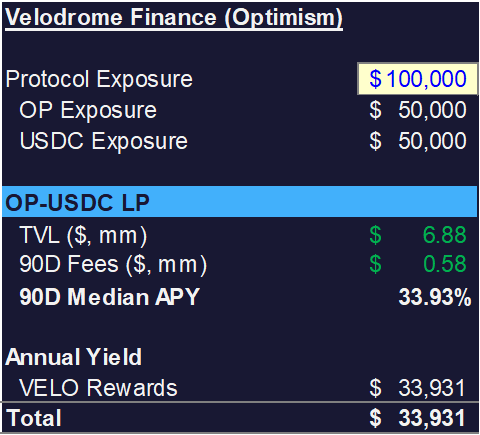
We allocate $100k to the OP-USDC LP pool on Velodrome, yielding equal exposure to OP and USDC. The yields on Velodrome vary from week to week according to gauge votes, hence we utilize the 90D median to account for volatility. This understates the yield, however, as the current epoch features a 59% APR. The rewards from velodrome are purely emissions, since trading fees accrue to gauge voters who direct said emissions.
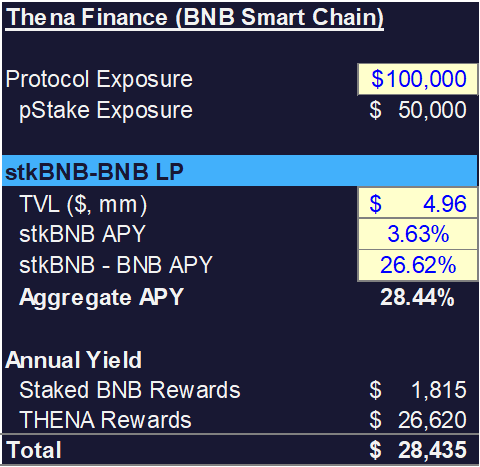
Thena Finance (BNB Smart Chain)
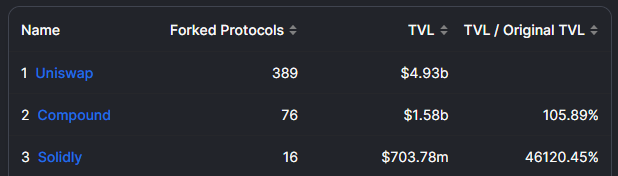
Thena Finance is another Solidly fork built on BNB Smart Chain. While having two forks of the same protocol may be perceived risky by some, it is not without good reason. Solidly (16) is one of the most forked protocols behind Uniswap (389) and Compound (76), yet its forks have ~461 times the TVL of Solidly. This is an indicator of healthy demand for the Solidly flywheel and is supported by attractive yields shown below.
Figure: Fork Protocols by Number and TVL
Through Thena Finance, we allocate $100k to the BNB/stkBNB pool. stkBNB is a liquid staking derivative (LSD) of BNB offered by pStake, with BNB’s 3.63% PoS yield accruing to stkBNB via the cToken model. This yield is ‘double dipped’ with BNB/stkBNB’s 26.62% inflationary APR to provide an aggregate APR of 28.44%.
Figure: Thena Finance Allocation (stkBNB-BNB Pool)
Uniswap v3 (Polygon)
Although Uniswap should need no introduction to DeFi Digest readers, the wMATIC-USDT pool pool to which we are allocating $100k utilizes the v3 formula instead:
(X + (L/√Pb))(Y + L√Pa) = K, where
- X = Quantity of Asset X
- Y = Quantity of Asset Y
- L = Liquidity = √K
- Pa = Lower Tick Range
- Pb = Upper Tick Range
Figure: Uniswap Allocation (wMATIC-USDT v3 Pool)
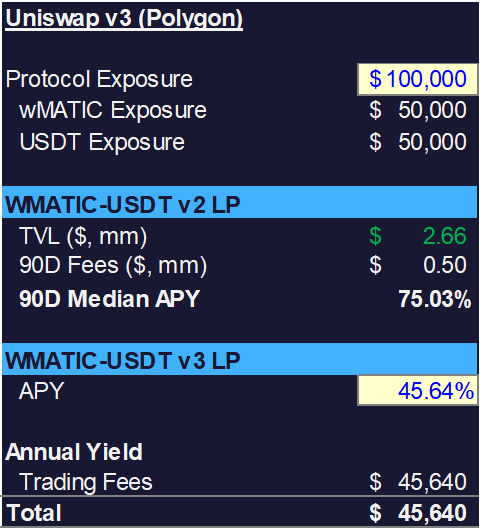
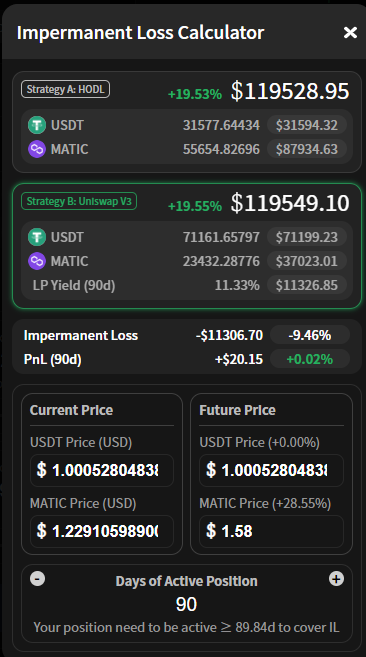
The v3 formula allows liquidity providers to provide liquidity in a pre-determined range instead of uniformly across 0 and ∞. This concentrated liquidity not only increases trading fees accrued per dollar of liquidity provided, but also magnifies impermanent losses. Another way of looking at the ranges are progressive limit bids and limit asks along the range. Assuming a range of $1.0 to $2.0, the strategy yields an APR of 45.64% and is indifferent (rewards = impermanent loss) between holding and LP-ing the tokens assuming MATIC price ends at $1.58 after 90 days.
Figure: Impermanent Loss Calculations for wMATIC-USDT
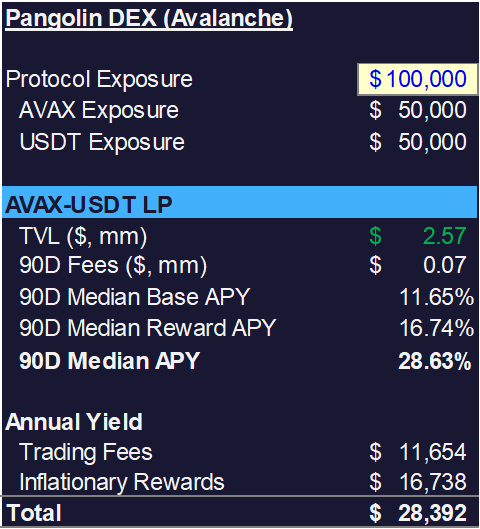
Pangolin DEX (Avalanche)
Pangolin DEX is a DEX that initially launched on Avalanche but has since expanded to Flare, Hedera, EVMOS and NEAR Layer 1s. Our allocation of $100k to the AVAX-USDT LP is split equally amongst AVAX and USDT, yielding the position 11.65% in trading fees and 16.74% in inflationary rewards for a 90D Median of 28.63%. Pangolin was incubated as part of the Avalanche Rush program but has since expanded across chains.
Figure: Pangolin DEX Allocation (AVAX-USDT LP)
Ribbon Finance (Ethereum)
Figure: Ribbon Finance Allocation (wBTC Covered Calls)
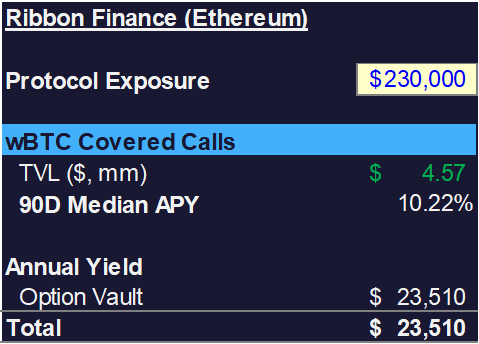
Previously covered in Z2O – Decentralized Options, Ribbon Finance is a protocol offering vaults that algorithmically sells implied volatility using covered call options. While some may perceive selling option delta as ‘picking pennies in front of a steamroller,’ the data below speaks for itself.
Figure: BTC Implied vs Realized Volatility (1w Basis)
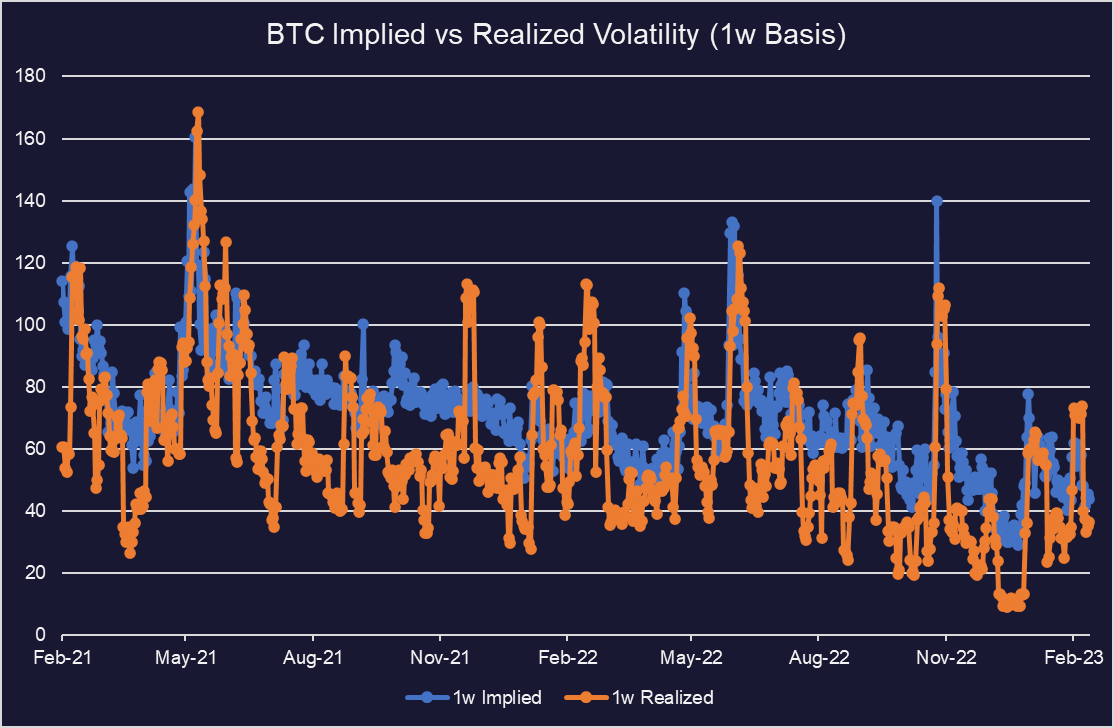
On a weekly basis, Bitcoin Realized Volatility often comes short relative to Implied Volatility, implying a positive IV-RV spread (volatility risk premium). This is because demand for options as a hedging instrument consistently outweighs supply from option writers, compensating them for taking the additional vega and gamma risk. Utilizing Ribbon’s vaults allow the portfolio capitalize on this imbalance (10.2%), as illustrated by covered call vault performance since inception (6 months) below.
Figure: wBTC Covered Call Vaults

Pendle Finance
Should Shanghai compress staking yields as more ETH gets staked, the illustrative portfolio’s ETH yield exposure can be best hedged via Pendle Finance. The platform does this by splitting a yield-bearing token into its respective Principal Token (PT) and Yield Token (YT).
Figure: Pendle Finance Allocation (wstETH-wETH LP)
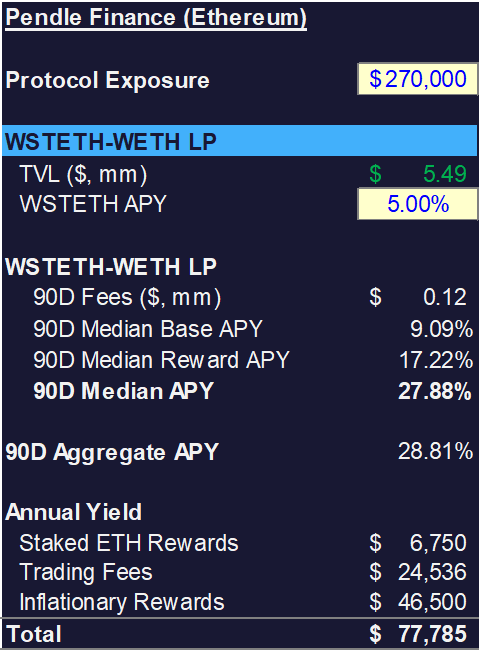
The separation of principal and fixed-income risk introduces a myriad of strategies that can be implemented, including using yield-bearing assets to offer discounted prices and solely holding PT to maturity to realize fixed yield. Specifically, we will be blending ~5% in stETH yield (for securing the network), ~9% trading fees for the LP pair, and the ~17% discounted PT at maturity (27th June 2024).
Holding a YT until maturity will also imply a synthetic long position on yield direction – a higher future yield will imply a higher price for YT. Having a directional view on yields isn’t within the strategy’s mandate, however.
Portfolio Return & Risk
Figure: Portfolio Return & Risk Metrics
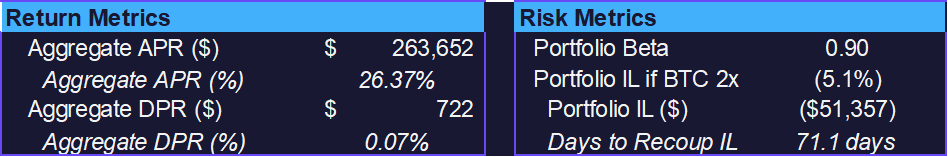
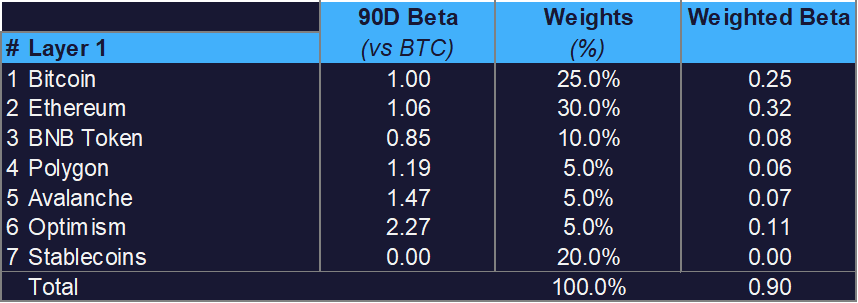
Figure: Portfolio Weighted Beta
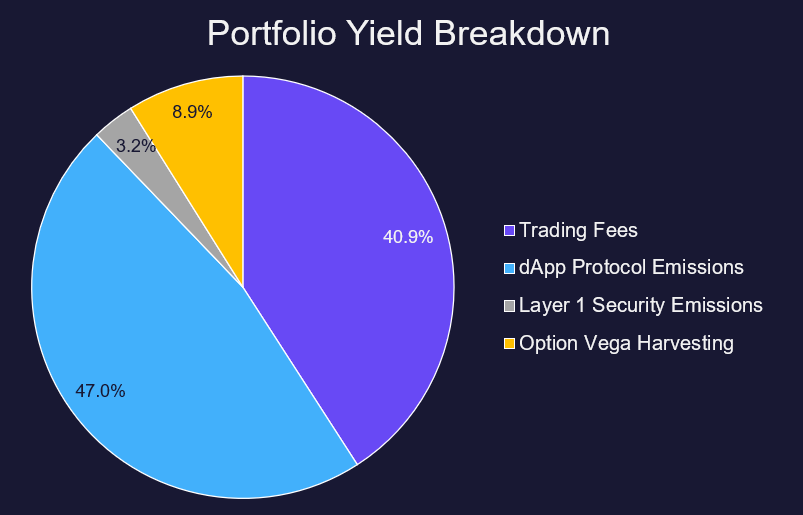
The strategies described above blend to a 26.4% APR on a $1m portfolio. The returns stem from trading fees (41%), dApp protocol emissions (47%), Layer 1 Network Emissions (3%), and harvesting option vega (9%). Among the sources yield, native dApp token emissions are the most transient as the inflationary rewards depend on token prices.
Figure: Portfolio Yield Breakdown
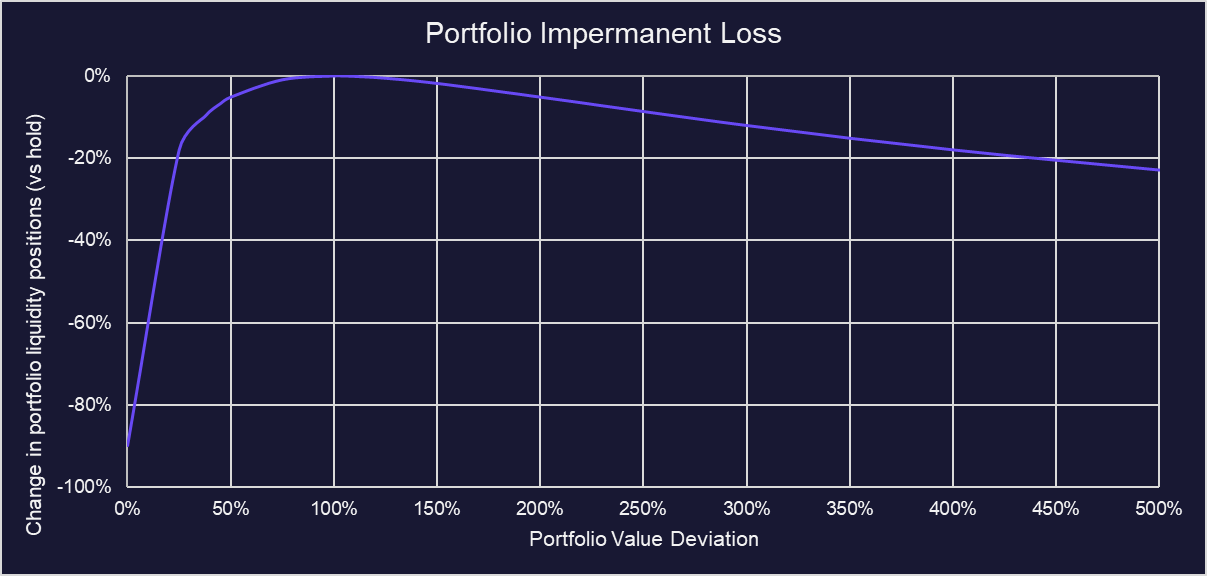
Should BTC 2x from here (~45k), the portfolio will take 71 days to recoup the portfolio IL assuming the same yields today. This is conservative given yields will inevitably grow with a bull market, with newer protocols vying for liquidity with token emissions.
As a refresher, impermanent loss is the loss in the LP pool value that occurs due to deviations in asset value. The portfolio’s beta is relatively muted given the 20% stablecoin allocation and is reflected in portfolio-wide IL.
Figure: Portfolio Impermanent Loss
Apart from price risk, staking and re-staking tokens on different platforms expose the portfolio to smart contract risk. This risk is somewhat mitigated as all of the pools above are audited.
Bottom Line
Should investors expect BTC to range between $11.25k and $45.0k in the next 71 days, they can take advantage of the yield strategies described above for a 26.4% projected annualized return. More than half of the yields are non-inflationary, indicating the yield sources are relatively more sustainable and yield sustainability is primarily subject to TVL changes.