Why Bitcoin likely bottoms out in July
Key Takeaways
- SPX trend turned back to negative on Tuesday; Challenge of lows likely post July 4
- Bitcoin DeMark exhaustion could pinpoint a major low in July
- Cycle analysis also shows Bitcoin to be bottoming out and turning back up in July
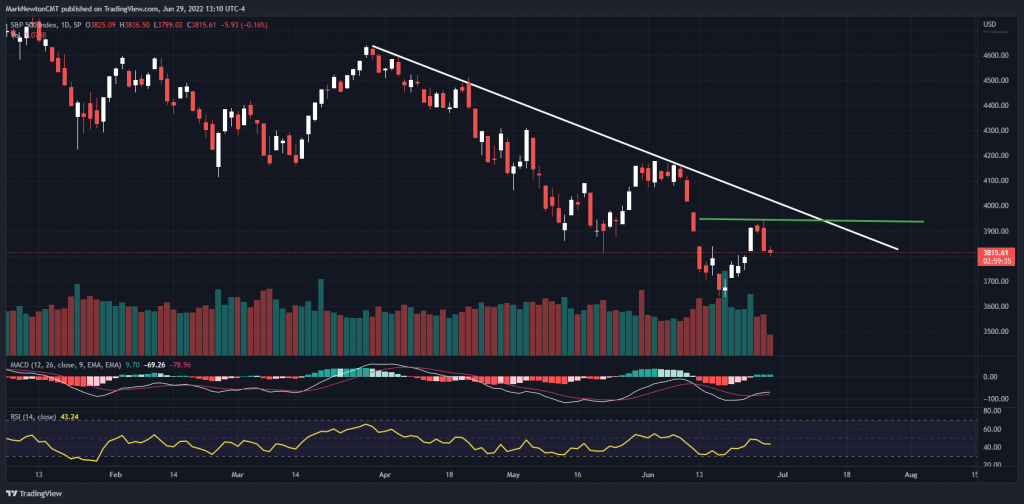
The SPX showed just minor downside follow-through after Tuesday’s reversal but might not immediately weaken down to prior lows ahead of the US July 4th holiday. As mentioned, prices reversed on cue Tuesday due to a combination of Elliott-wave analysis with Gann analysis which provided price and time targets based on the prior June 16th bottom. I expect that the next couple days might show prices attempting to stabilize and bounce by a minor amount. Yet, trends now have turned bearish, and I do not anticipate that Tuesday’s highs of 3945.86 will be taken out before prices make their way down to challenge and undercut 3636.87, even if this might require a couple weeks. Overall, while I do suspect markets are in the final wave down from late March (which should bottom in July at marginally lower lows) momentum and trends are bearish. Any retest of lows and violation will likely produce some ample positive momentum divergence and exhaustion signals which should provide buy signals for this decline. At present, this is still early, but any pre-July 4th bounce likely is a selling opportunity for July weakness.
Bitcoin could show Weekly, Monthly Exhaustion lining up in July
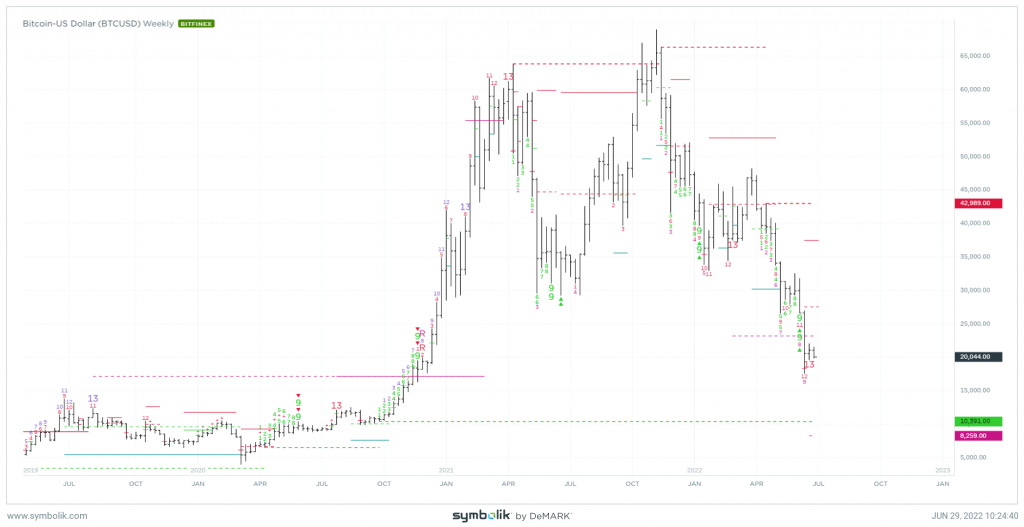
While I don’t often publicly comment on my interpretation of how I use Tom DeMark’s indicators, it’s important to see that we’re nearing a time of potential confluence on a weekly and monthly basis for the first time all year when utilizing the DeMark TD Sequential and TD Combo indicators. While I’ll leave the educational content and settings for how to use and interpret these indicators to the investor, I’m happy to provide a few key takeaways of my own personal analysis when using DeMark’s indicators on Bitcoin (BTCUSD) below.
- TD Sequential indicator (on a Weekly basis) shows a completed but unconfirmed 13 Countdown signal, whereas TD Combo requires at least another four weeks at a minimum, to be in alignment in generating its own 13 countdown.
- It might be necessary that TD Combo also show 13 countdowns to join with TD Sequential before any major low in BTCUSD. (Weekly)
- Prior weekly TD Combo signals in August 2019 were effective near the peak, along with early 2021 on TD Sequential, but proved short-lived (3 weeks) back in early 2022 just above $35,000
- Monthly signals are premature by one month for the purposes of possibly generating a TD Buy Setup (9 count) An 8 count could arrive in July, but would need to be lower than June’s bottom to officially “perfect” the TD Buy Setup, if this occurs.
Overall, (and I’ll ignore the daily signal for this conclusion) I would have greater confidence of a larger low developing in Bitcoin if/when both weekly and monthly charts are in alignment. This very well might come to fruition for the first time since last November’s peak in 2021, as of next month, July 2022. Multiple timeframes lining up typically provide longer-lasting trend reversals, and we could be on the verge of seeing all come together.
(As a side note, these aren’t Tom DeMark’s rules, but simply my own way of utilizing these indicators. He has not endorsed my analysis as being valid, and I am simply showing a few of my own ways of combining timeframes to make these projections.)
BTC Wave projections suggest any further weakness should hold 12k
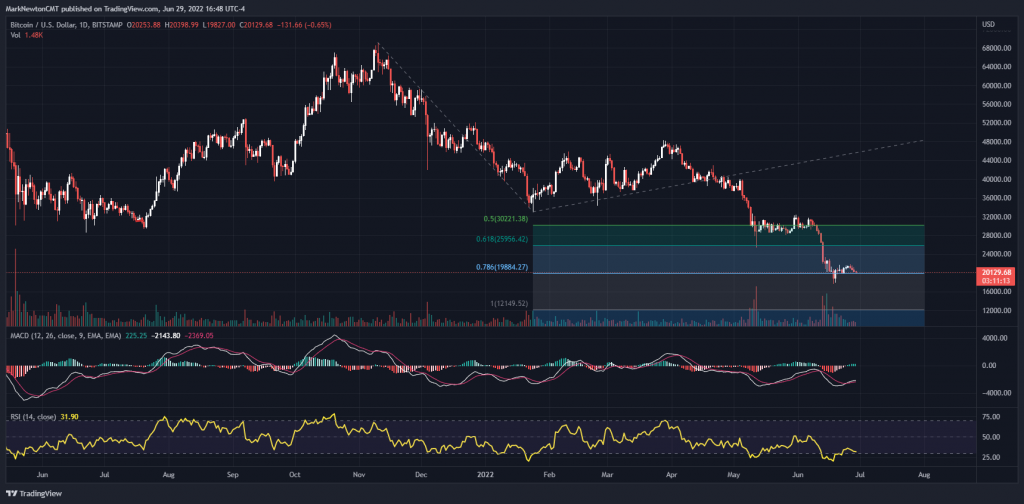
When measuring the length of the first decline from November 2021 and comparing to the more recent one from late March, we see that prices made an alternative Fibonacci retracement near the 61.8% level, which was important into mid-May.
Now prices have deteriorated further and lie near the 78.6% level. Given that Equities still look to possibly fall into mid-July, it’s likely that BTCUSD also could follow suit and challenge and undercut June lows at 17,592.78 by a minor amount.
If this happens into July, one should be on the lookout for these waves to be equal, which would project to 12,185. Given that some traders might be inclined to buy dips on such a move, I feel technically that $12,500-$13,000 would be my preferred area to buy dips in the event that $17,592 is taken out. I expect any move down to this level should prove brief, and short-lived, but provide an excellent buying opportunity into mid-July.
Bitcoin cycles start to turn higher between July and November
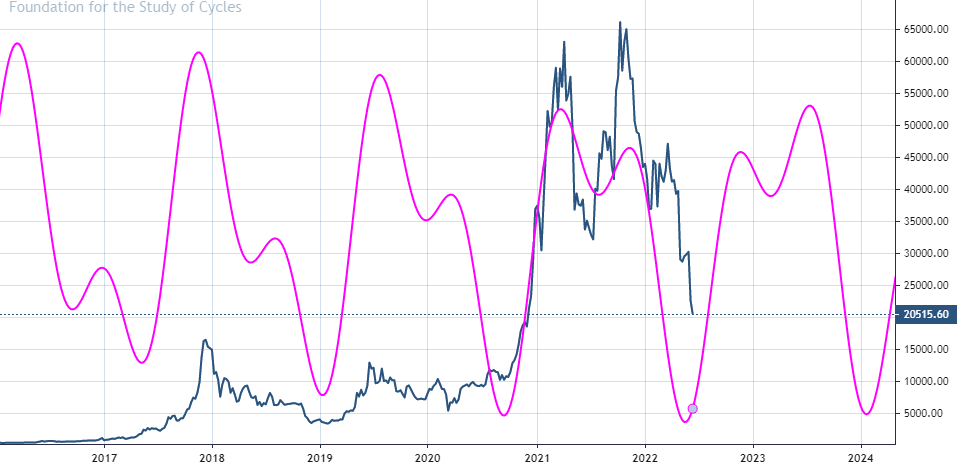
Bitcoin has had good success over the last dozen years at making cyclical lows every 90 weeks. When taking half of this length, or 45 weeks and combining these as a cycle composite, one can see that many of the highs and lows have occurred at pretty regular intervals.
The peaks from early and late 2021 happened nearly on schedule. Furthermore, the peak from late 2017 as well as 2019 also fit with this picture and seem to have been successful.
Conversely, the lows from late 2020, early 2019 and also mid-2017 all occurred when this composite bottomed and turned higher.
The current forecast is for a Summer bottom which likely happens in July and turns up into November of this year, with minor dips into Spring 2023 providing buying opportunities for further strength into late 2023. Thus, lows should be right around the corner according to this cycle composite, and one should be on alert in the month of July, looking to buy weakness for a healthy rebound, just as sentiment seems to be reaching a bearish tipping point.


