
LFG

Key Takeaways
- Despite another bullish week for Bitcoin, funding rates for perpetual futures remain subdued, suggesting a lack of froth in the market.
- A pronounced uptick in realized cap indicates that organic inflows are driving Bitcoin’s most recent uptick in price and provide a view into just how illiquid the spot market is.
- We examine the Luna Foundation Guard’s (LFG) mission to use bitcoin as a reserve asset for Terra. We provide clients with an analysis of how this purchasing campaign could help buoy market prices in the near term.
- Last week we attended the Avalanche Summit, where over 3,500 builders and investors gathered to develop connections and exchange insights on the direction of the Avalanche Network. We summarize insights gained from this experience.
- Bottom Line: In our annual outlook, we expected a choppy first half of 2022, and so far, this year has met these expectations. While we do not believe the market is completely beyond the macro and geopolitical headwinds that have weighed on cryptoasset prices, we think that (1) large and consistent bids from LFG, (2) favorable seasonal trends, (3) and a derivatives market that has yet to exhibit signs of speculation, could help this current relief rally extend into April.
Weekly Recap
It was another week of green candles across the crypto ecosystem as bitcoin flirted with its 200-day moving average for the first time in several months.

Like last week, the more speculative sectors outperformed the prior 7-days, with the once-beleaguered DeFi sector continuing to turn some heads.

Source: Messari
Below we examine some of the reasons we think that this relief rally mirrors those seen in late 2021 and why this rally might have some legs on it.
No Signs of Overextension
A good barometer of whether a rally is sustainable or not is how traders are positioned. While every trade has a long position that counters every short, we can reasonably ascertain whether the market is positioned “net-short” or “net-long” using funding rates for perpetual futures contracts as a proxy for demand for a particular side of the trade.
As a reminder, high funding rates indicate increased demand for long positions – longs are paying shorts to take the other side of the trade. Conversely, negative rates indicate increased demand for the short side of the trade.
Below, if we plot rolling 30-day daily returns with rolling 30-day average funding rates, we can see a somewhat predictable pattern emerge where consistent daily returns result in momentum traders entering the fold late and creating a frothy environment within the “perps” market until the trend ultimately reverses as interest in the spot market wanes.
(As an aside, it is interesting to note that every time 30-day funding rates have turned negative, it has preceded bullish price action. This is something we will be watching moving forward.)

Source: Fundstrat, Glassnode
Thus far, we can see that the recent price increases have not been accompanied by a significant uptick in rolling funding rates just yet. This indicates to us that the rally has been driven by organic spot bids coupled with a highly illiquid spot market.

Source: Fundstrat, Glassnode
Demand-side starting to show signs of life
Turning to the on-chain metrics that we have been monitoring for changes in demand, we can see that the organic nature of the recent rally is confirmed by USD inflows into the Bitcoin network.
Last week, we acknowledged that despite the promising price action following the rally past $40k, much of the buying action was from wallets with a lower cost basis purchasing coins sold by those that were underwater. This means that the funds that entered the fold to buy coins at the top of the market were leaving.
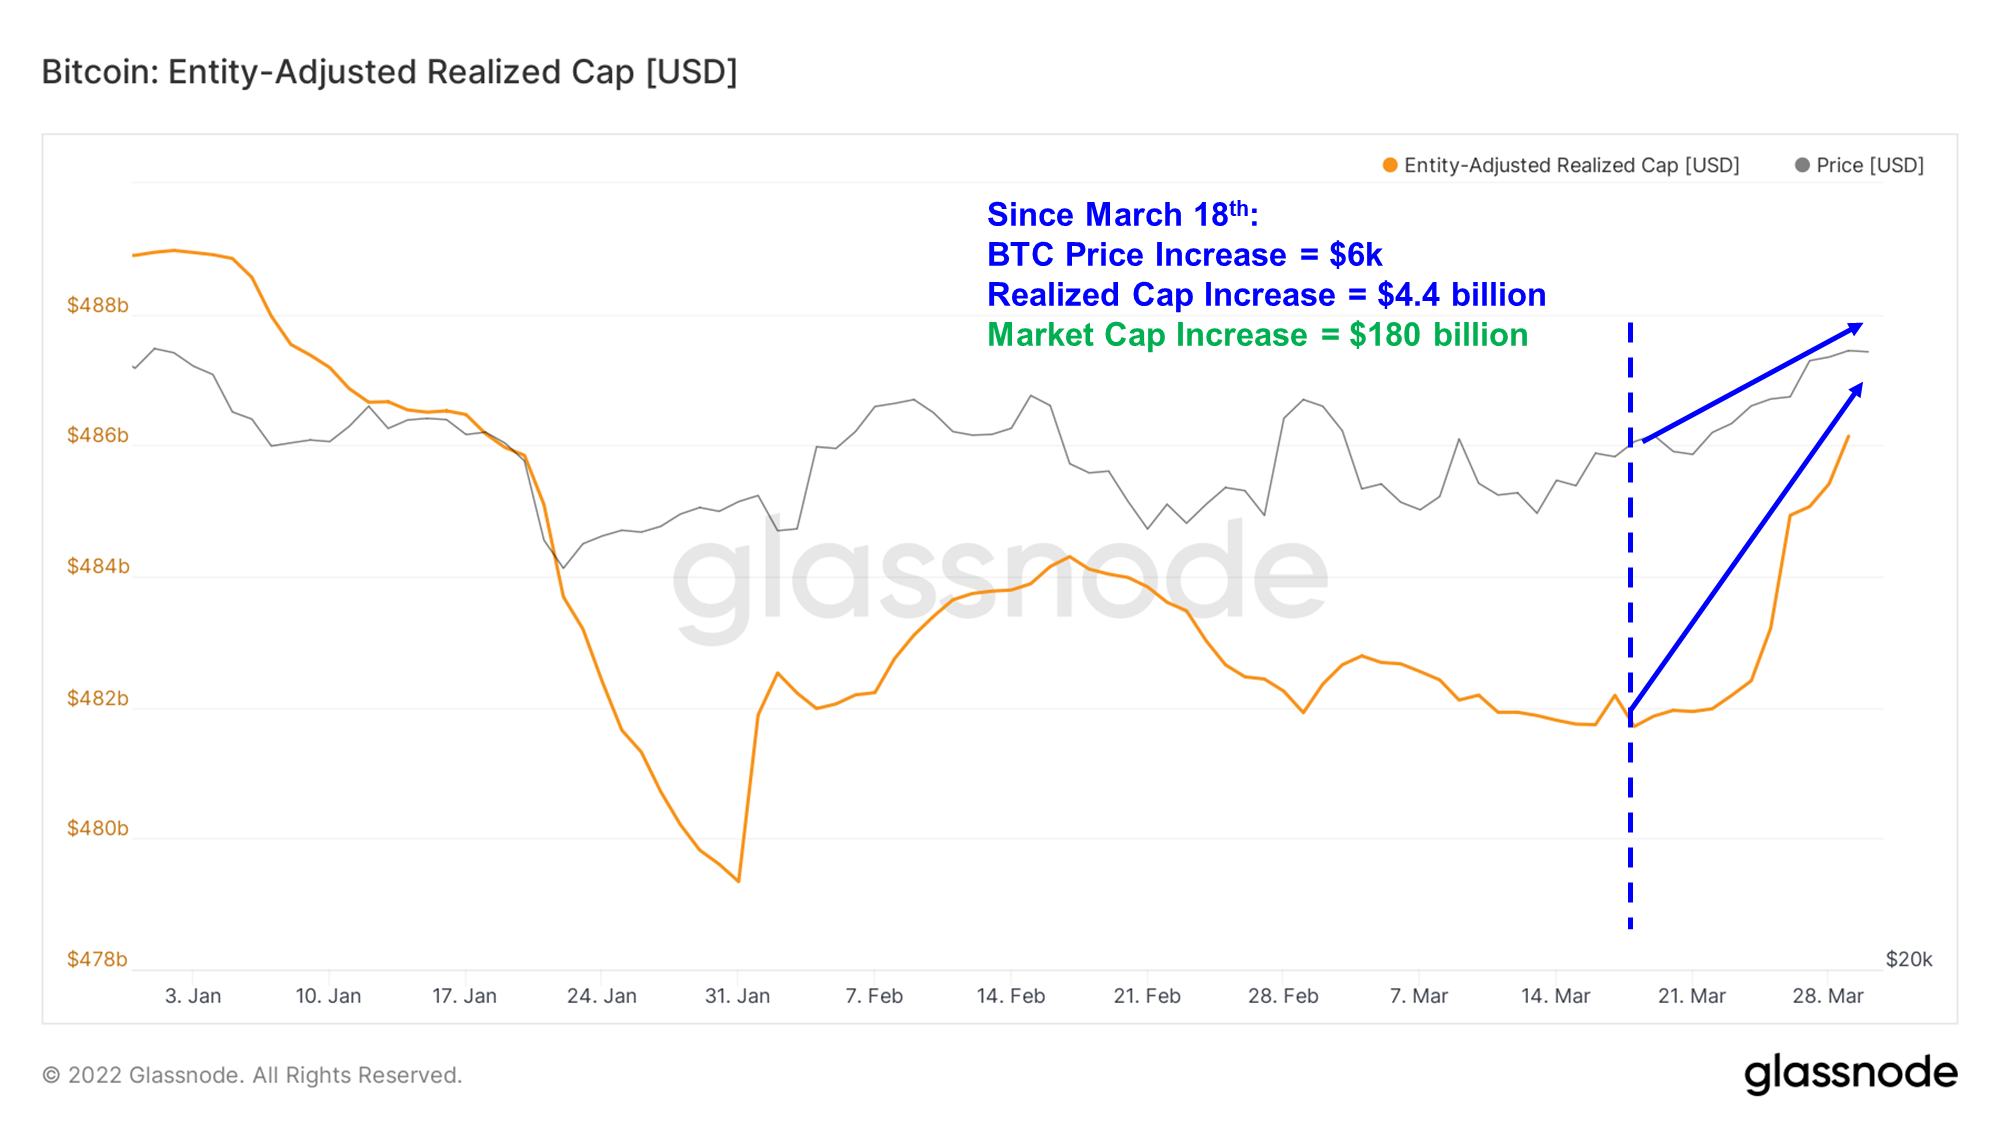
Below, we can see an encouragingly sharp uptick in the realized cap over the past week, indicating that funds are flowing into the network. Since March 18th, realized cap has increased by approximately $4.4 billion, while Bitcoin’s market cap has increased by nearly $180 billion (That’s a 41x multiplier effect).
We think the outsized impact these fund inflows have had on bitcoin’s price reflects the illiquid spot environment we have been discussing ad nauseum recently.
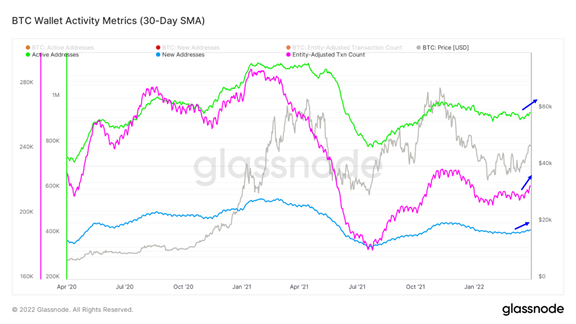
Reviewing wallet activity metrics demonstrates a continued increase in demand returning to the network. Of the metrics mapped out below, transaction count appears to have the most conclusive upward trajectory. We will continue to monitor new and active address counts for continued bullish momentum.
LFG Making Things Interesting
Turning to the question of where spot demand is coming from, we revisit the LUNA Foundation Group (LFG) and their mission to acquire bitcoin as a reserve asset for the Terra (LUNA) network. Over a month ago, we discussed the Terra (LUNA) blockchain’s adoption of bitcoin as a reserve asset and examined the resulting implications on algorithmic stablecoins, regulation, and bitcoin as the ultimate reserve asset. You can revisit this note and our subsequent note on LUNA’s outperformance to get a refresher on how the Terra ecosystem works and the mission that the LFG set out with.
We have discussed how the announcement of the LFG purchase had a positive effect on the LUNA price. We think this is mainly due to the increased confidence in the platform derived from bringing a decentralized gold standard in to serve as a backstop for the UST -0.01% holders.
However, these initial purchases made by LFG had a limited effect on bitcoin’s price. In fact, the first LFG bitcoin purchase was completed well before the press release before bitcoin reached its YTD low. (to track purchases by LFG, you can view its wallet metrics here).
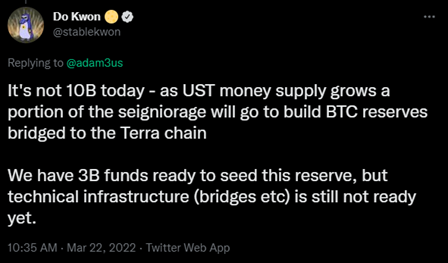
Last week, in the middle of what we have characterized as a low liquidity environment that has recently become somewhat exhausted of sell pressure, Terra founder Do Kwon announced that the LFG had actually raised $3 billion in funds to acquire BTC -1.53% reserves and would be deploying them immediately. He further added that there is a plan to employ a seigniorage model to this acquisition process whereby the Terra platform would use fees incurred to purchase up to $10 billion in BTC over the long term.
Starting last week, LFG has deployed its capital rapidly, making TWAP purchases averaging approximately $140 million per transaction over nine days. To date, LFG has deployed $1.3 billion of the $3 billion earmarked for bitcoin.
As demonstrated by our charts below, bitcoin has been quite the beneficiary of these fund inflows, breaking out decisively towards the beginning of last week.
While we have had institutional investors bring volume to the market, we have not had a period through which there was such a consistent and telegraphed bid at this scale. Coupled with the fact that we are dealing with a persistently illiquid bitcoin supply, it makes sense why bitcoin’s price has reacted the way it has.

Source: Fundstrat, OKLink, Glassnode
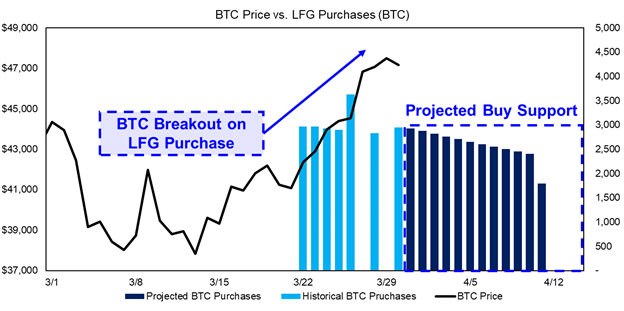
To get a sense of what to expect in the coming weeks, we completed a simple projection in which we assumed:
- Average daily purchases remain at approximately $140 million
- The purchases are made daily until the $3 billion is exhausted
- BTC price increases at an average of 2% per day (this has been the average daily price increase since LFG purchases commenced)
Applying these conservative assumptions, we can see that the LFG buy support should sustain through the next ten days.
Source: Fundstrat, OKLink, Glassnode
To be clear, myriad factors could render this exercise moot. LFG could decide to forego purchases until price retreats, or BTC price could spike in either direction caused by external factors that are beyond the scope of this analysis. However, we think this is a reasonable forecast to demonstrate the support that LFG might provide the market in the near term.
To further conceptualize this buying pressure, we can plot LFG purchases against the daily new issuance of BTC, which averages around 900 BTC per day. If miners were to liquidate their rewards upon issuance, LFG would provide enough liquidity to cover this sell pressure.
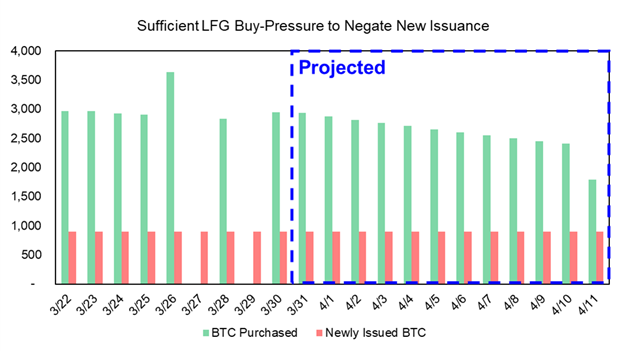
Source: Fundstrat, OKLink, Glassnode
We think this persistent LFG bid is an excellent reason to believe that the current rally could sustain through the next several weeks.
A Reminder of Seasonal Trends
We also would like to resurface the seasonal trends we highlighted for our clients last week.
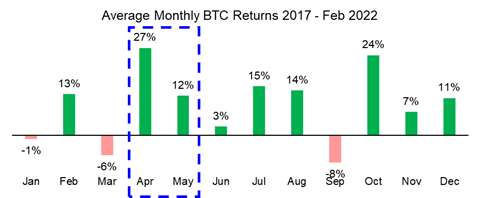
October widely received the moniker of “Uptober” just a few months ago. In the same spirit, April might be best referred to historically as Upril (I will admit, not as catchy).
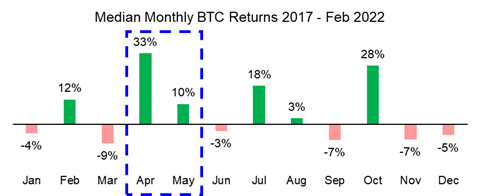
Source: Fundstrat, Coinglass


Source: Fundstrat, Coinglass
We discussed the reasons for this dynamic last week. To reiterate, the potential drivers are abundant – markets are complex systems that are a function of an endless number of variables. However, we think one contributing factor might be increased fund inflows following the resolution of tax liabilities and returns.
Many anticipate that investors will be hit with unsuspecting tax bills for capital gains realized in 2022. But from our experience, those who have remarkable capital gains typically have the foresight to have the liquidity to pay taxes on them. We think the resolution of tax season may give retail investors better clarity over how much capital they can deploy and possibly leads to favorable price action.
Regardless of the underlying reasons, we think these seasonal trends are another reason this current relief rally could persist.
Bottom Line: In our annual outlook, we expected a choppy first half of 2022, and so far, this year has met these expectations. While we do not believe the market is completely beyond the macro and geopolitical headwinds that have weighed on cryptoasset prices, we think that (1) large and consistent bids from LFG, (2) favorable seasonal trends, (3) and a derivatives market that has yet to exhibit signs of speculation, could help this current relief rally extend into April.
Avalanche Summit Recap
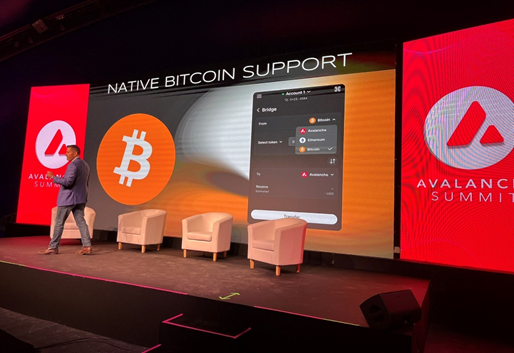
Last week I attended the Avalanche Summit, where over 3,500 builders and investors gathered to develop connections and exchange insights on the direction of the Avalanche Network. Below I will briefly summarize my key takeaways from this experience.
Source: Avalanche Foundation
- On-chain Analysis – I teamed up with Alex Svanevik of Nansen, Bobby Ong of CoinGecko, and Anastasia Melachrinos of Kaiko to chat about finding signal in on-chain data. It was a good topic to cover since I was the only one on the research and investing end, and on-chain data is something we employ in most of our analyses. The other panelists focused on the product development end of things, so it was good to contrast the different views and applications of on-chain data. A significant takeaway from discussions following the panel is that many people are still skeptical about fundamental on-chain analysis. I applied an analogy comparing on-chain data to a new global transparent accounting system, and based on conversations, this parallel stuck with some.
- Avalanche’s Narrow Focus on DeFi applications – As discussed in our research a few weeks ago, Avalanche is investing in their subnet ecosystem in a big way. Subnets effectively enable applications to build customizable chains that settle on the mainchain but can abide by different rules. Incentives provided to builders to create subnets will likely bring a lot of institutions into the fold. They will give access to DeFi liquidity pools but are generally inaccessible due to KYC requirements. In the future, I could see legacy gaming companies being inclined to apply this tiered permission structure to build on Avalanche as well, but based on the conference attendance, I could tell the big push was to get semi-permissioned DeFi on Avalanche rolling. There seemed to be a lot of centralized crypto companies and blue-chip DeFi projects in attendance and not quite as many fledgling web3 or NFT projects. At the conclusion of the conference, there was a $100 million initiative spearheaded by the Avalanche Foundation to fund projects related to art, entertainment, and culture, but this seemed overshadowed by the emphasis on institutional scaling.
- Subnet Adoption Accretive for Token Price – Setting up a subnet requires the purchase and stake of AVAX tokens, creating buy pressure and reducing liquidity. The emergence of new applications should also generally increase the amount of GDP generated on the network, thus increasing the value of the AVAX token. At some point, I would like to see the cost of setting up a validator be reduced to increase decentralization, but the current outlay should be fine for most projects with large treasuries.
- Bitcoin Continues its Move to Other Networks – An understated announcement from the conference, in our opinion, was the rollout of a bridge to bring native bitcoin to Avalanche. Developers also announced the launch of a new wallet designed to compete with MetaMask and support native bitcoin. This is yet another example (following Terra) of an alternative layer 1 network integrating bitcoin into its ecosystem so that it can be used in DeFi as the pristine collateral that it is.
- Deal Flow – Based on conversations, private deal flow shows no signs of slowing. Anecdotally, it seems like there is more capital than good projects to invest in, but that could change in a heartbeat.
The Avalanche Summit was an impressive event that lacked the typical “top signal” vibe that many of these conferences can sometimes emit. Of course, this could have a lot to do with the fact that we are well below the AVAX all-time high. We left with further conviction in AVAX as a long-term high-growth investment opportunity.